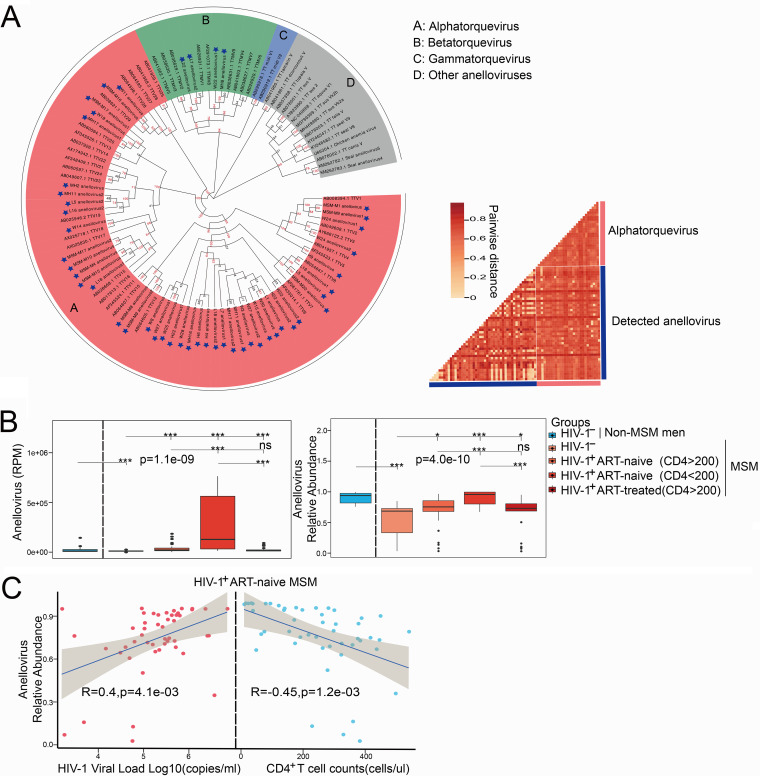
FIG 3.
Associations of anellovirus with HIV-1 infection and CD4+ T cell counts. (A, left) Phylogenetic tree of anellovirus; newly discovered anelloviruses are labeled with blue stars. The sample source of each anellovirus is indicated as follows: MSM-M, HIV-1-negative non-MSM; MH, HIV-1-negative MSM; W, HIV-1-infected ART-naive MSM (CD4 > 200); L, AIDS patients (CD4 < 200); H, HIV-1-infected ART-treated MSM (CD4 > 200). The number at the end of the name represents the number of full-length ORF1 genes obtained. (Right) The heat map represents the pairwise distance of anelloviruses. (B, left) Read count (normalized by RPM) of pegivirus in samples from different groups. (Right) Relative abundance of pegivirus in samples from different groups. (C) Spearman's correlation between anellovirus and HIV-1 viral load (left) and CD4+ T cell counts (right) in HIV-1-infected ART-naive MSM.

