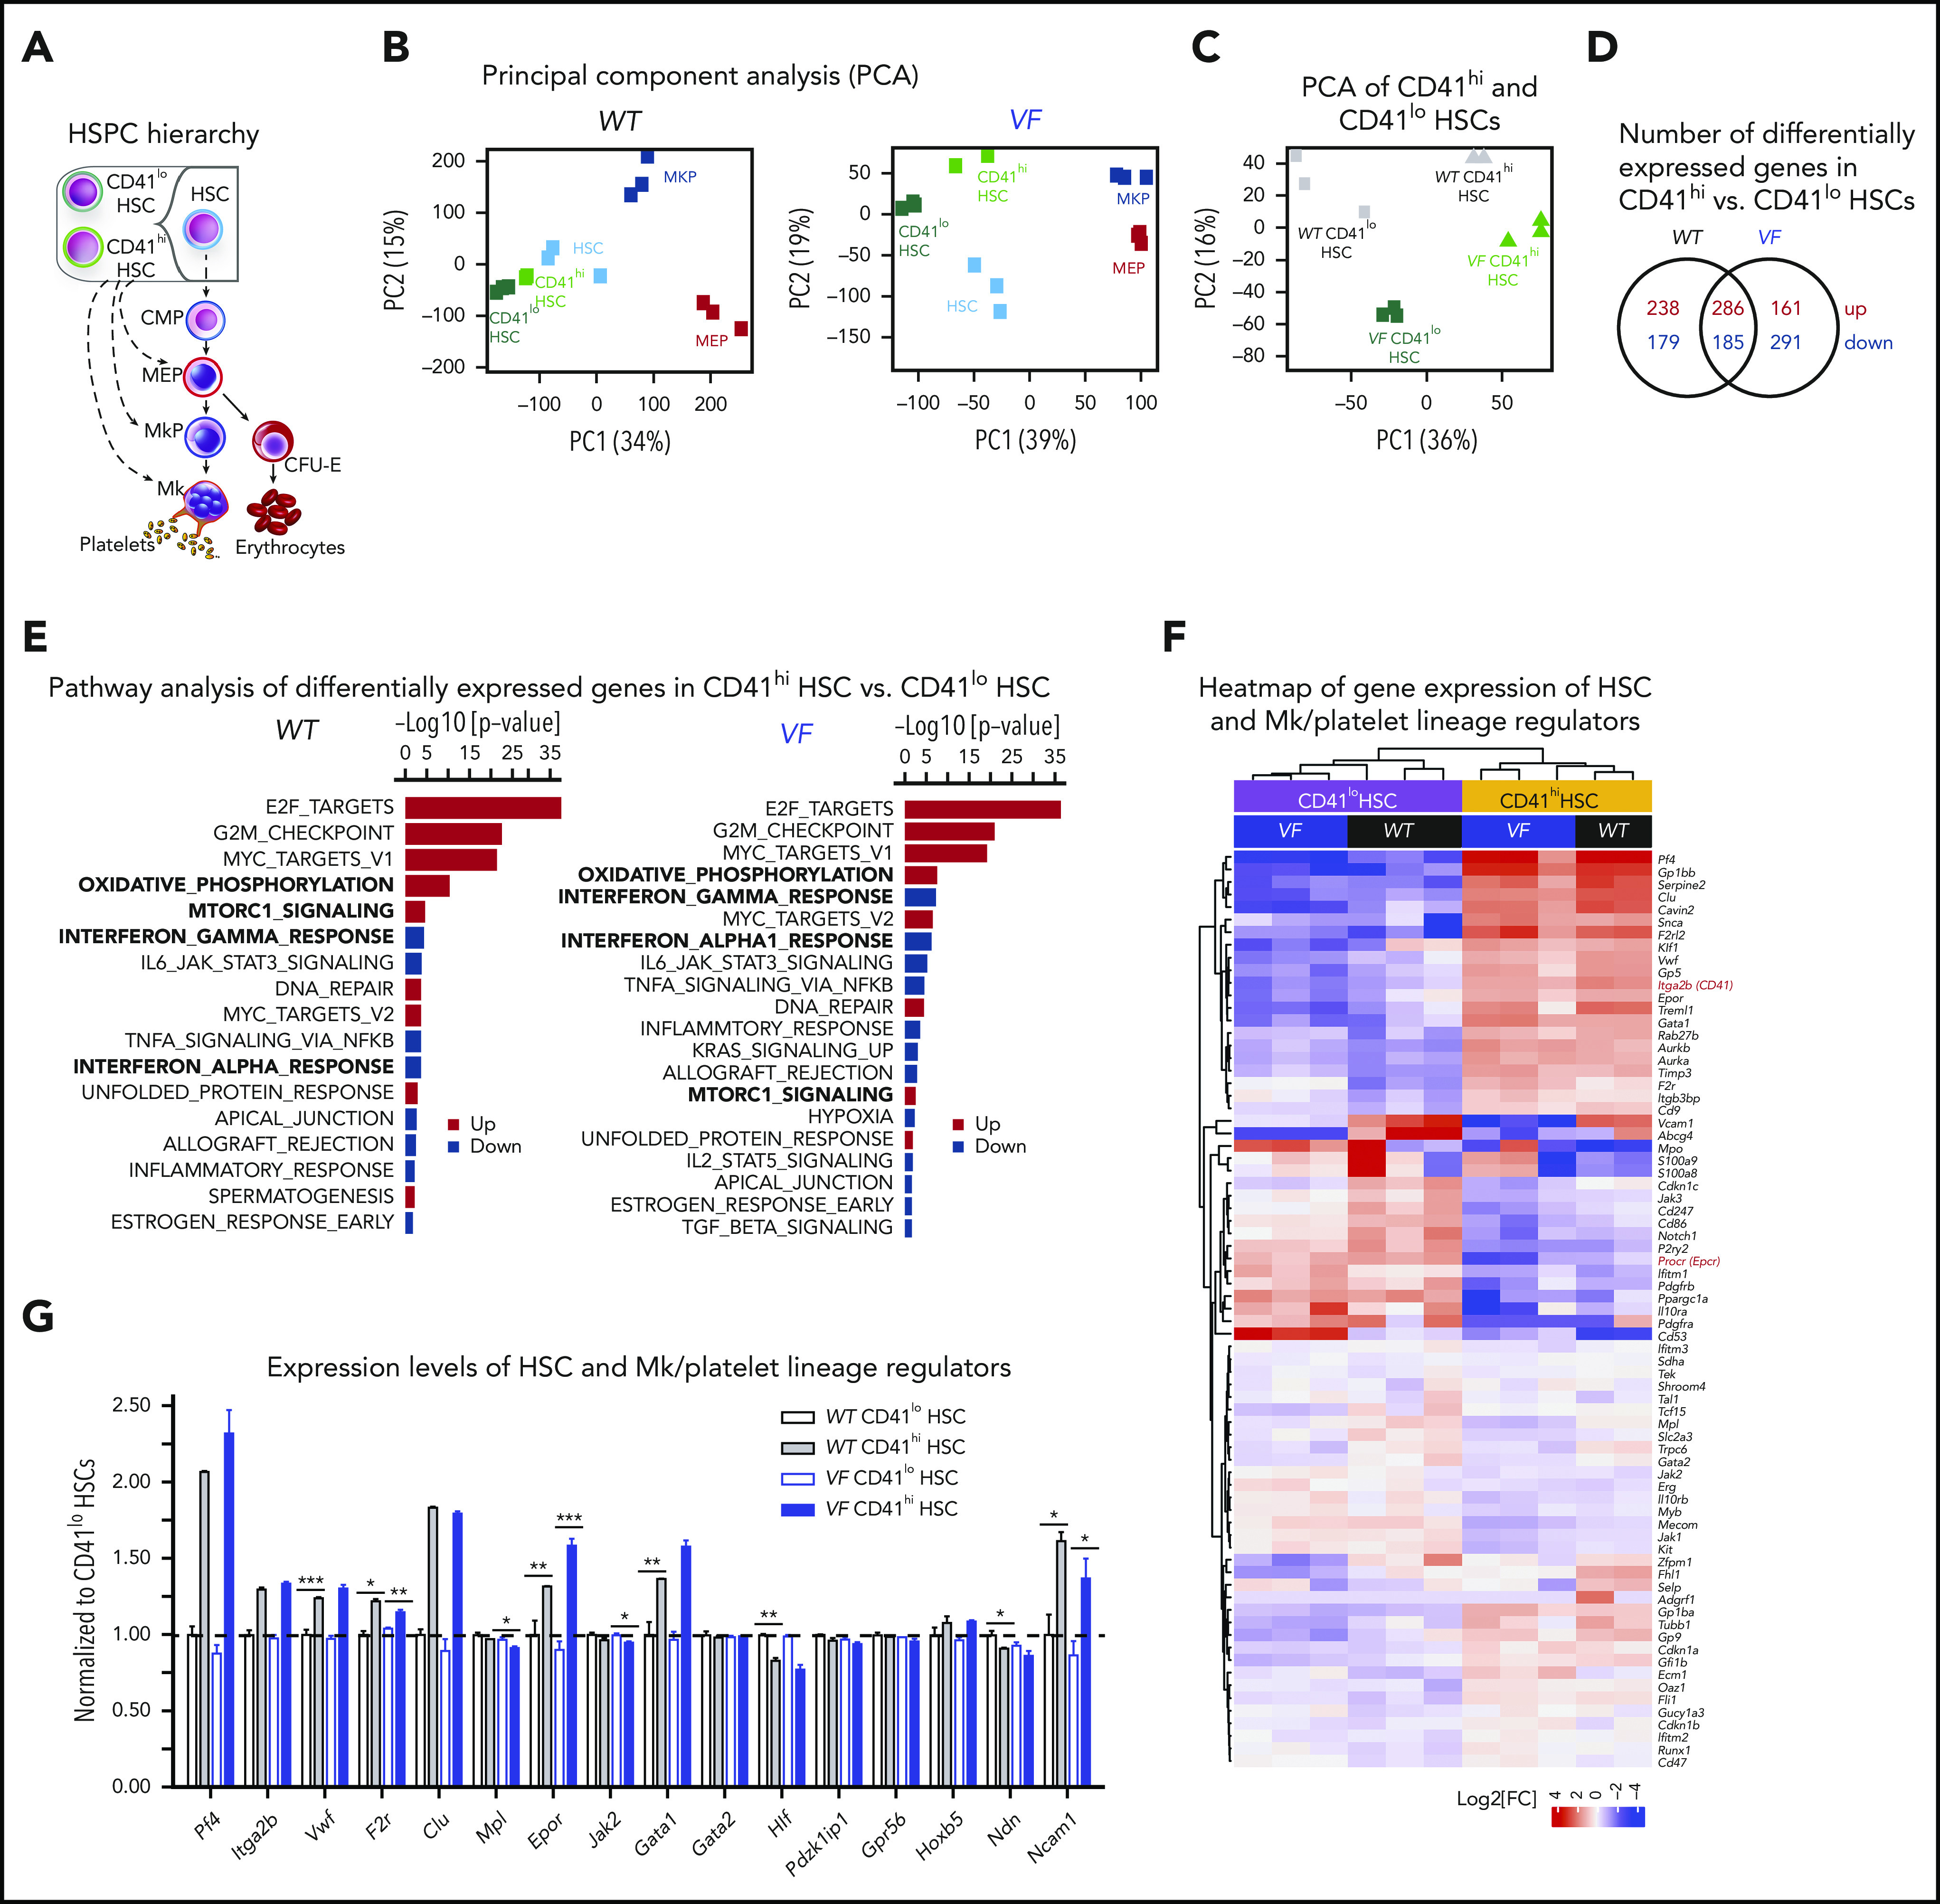
Figure 3.

RNA sequencing profiling of CD41hiand CD41loHSCs. (A) Stem and progenitor (HSPC) hierarchy. (B) PCA of the indicated HSPC subsets from WT and VF mice revealed transcriptional hierarchy within the HSPCs. (C) PCA of CD41hi and CD41lo HSC subsets from WT and VF mice. (D) The number of shared and differentially expressed genes in CD41hi and CD41lo HSC subsets between the WT and VF groups (false discovery rate [FDR] <.05 and fold change >1.5). (E) GSEA of differentially expressed molecular pathways from the MSigDB hallmark gene sets in CD41hi and CD41lo HSC subsets from WT and VF mice (FDR < .05). (F) Heat map of Mk/platelet lineage regulator expression in CD41hi and CD41lo HSC subsets from WT and VF mice (FDR <.05 and fold change >1.5). (G) Normalized expression levels of selected genes involved in HSC and Mk/platelet lineage regulation. The results obtained in CD41lo HSCs were set to 1 and compared with the corresponding values obtained in in CD41hi HSCs. Data are means ± standard error of the mean. *P < .05; **P < .01; ***P < .001.
