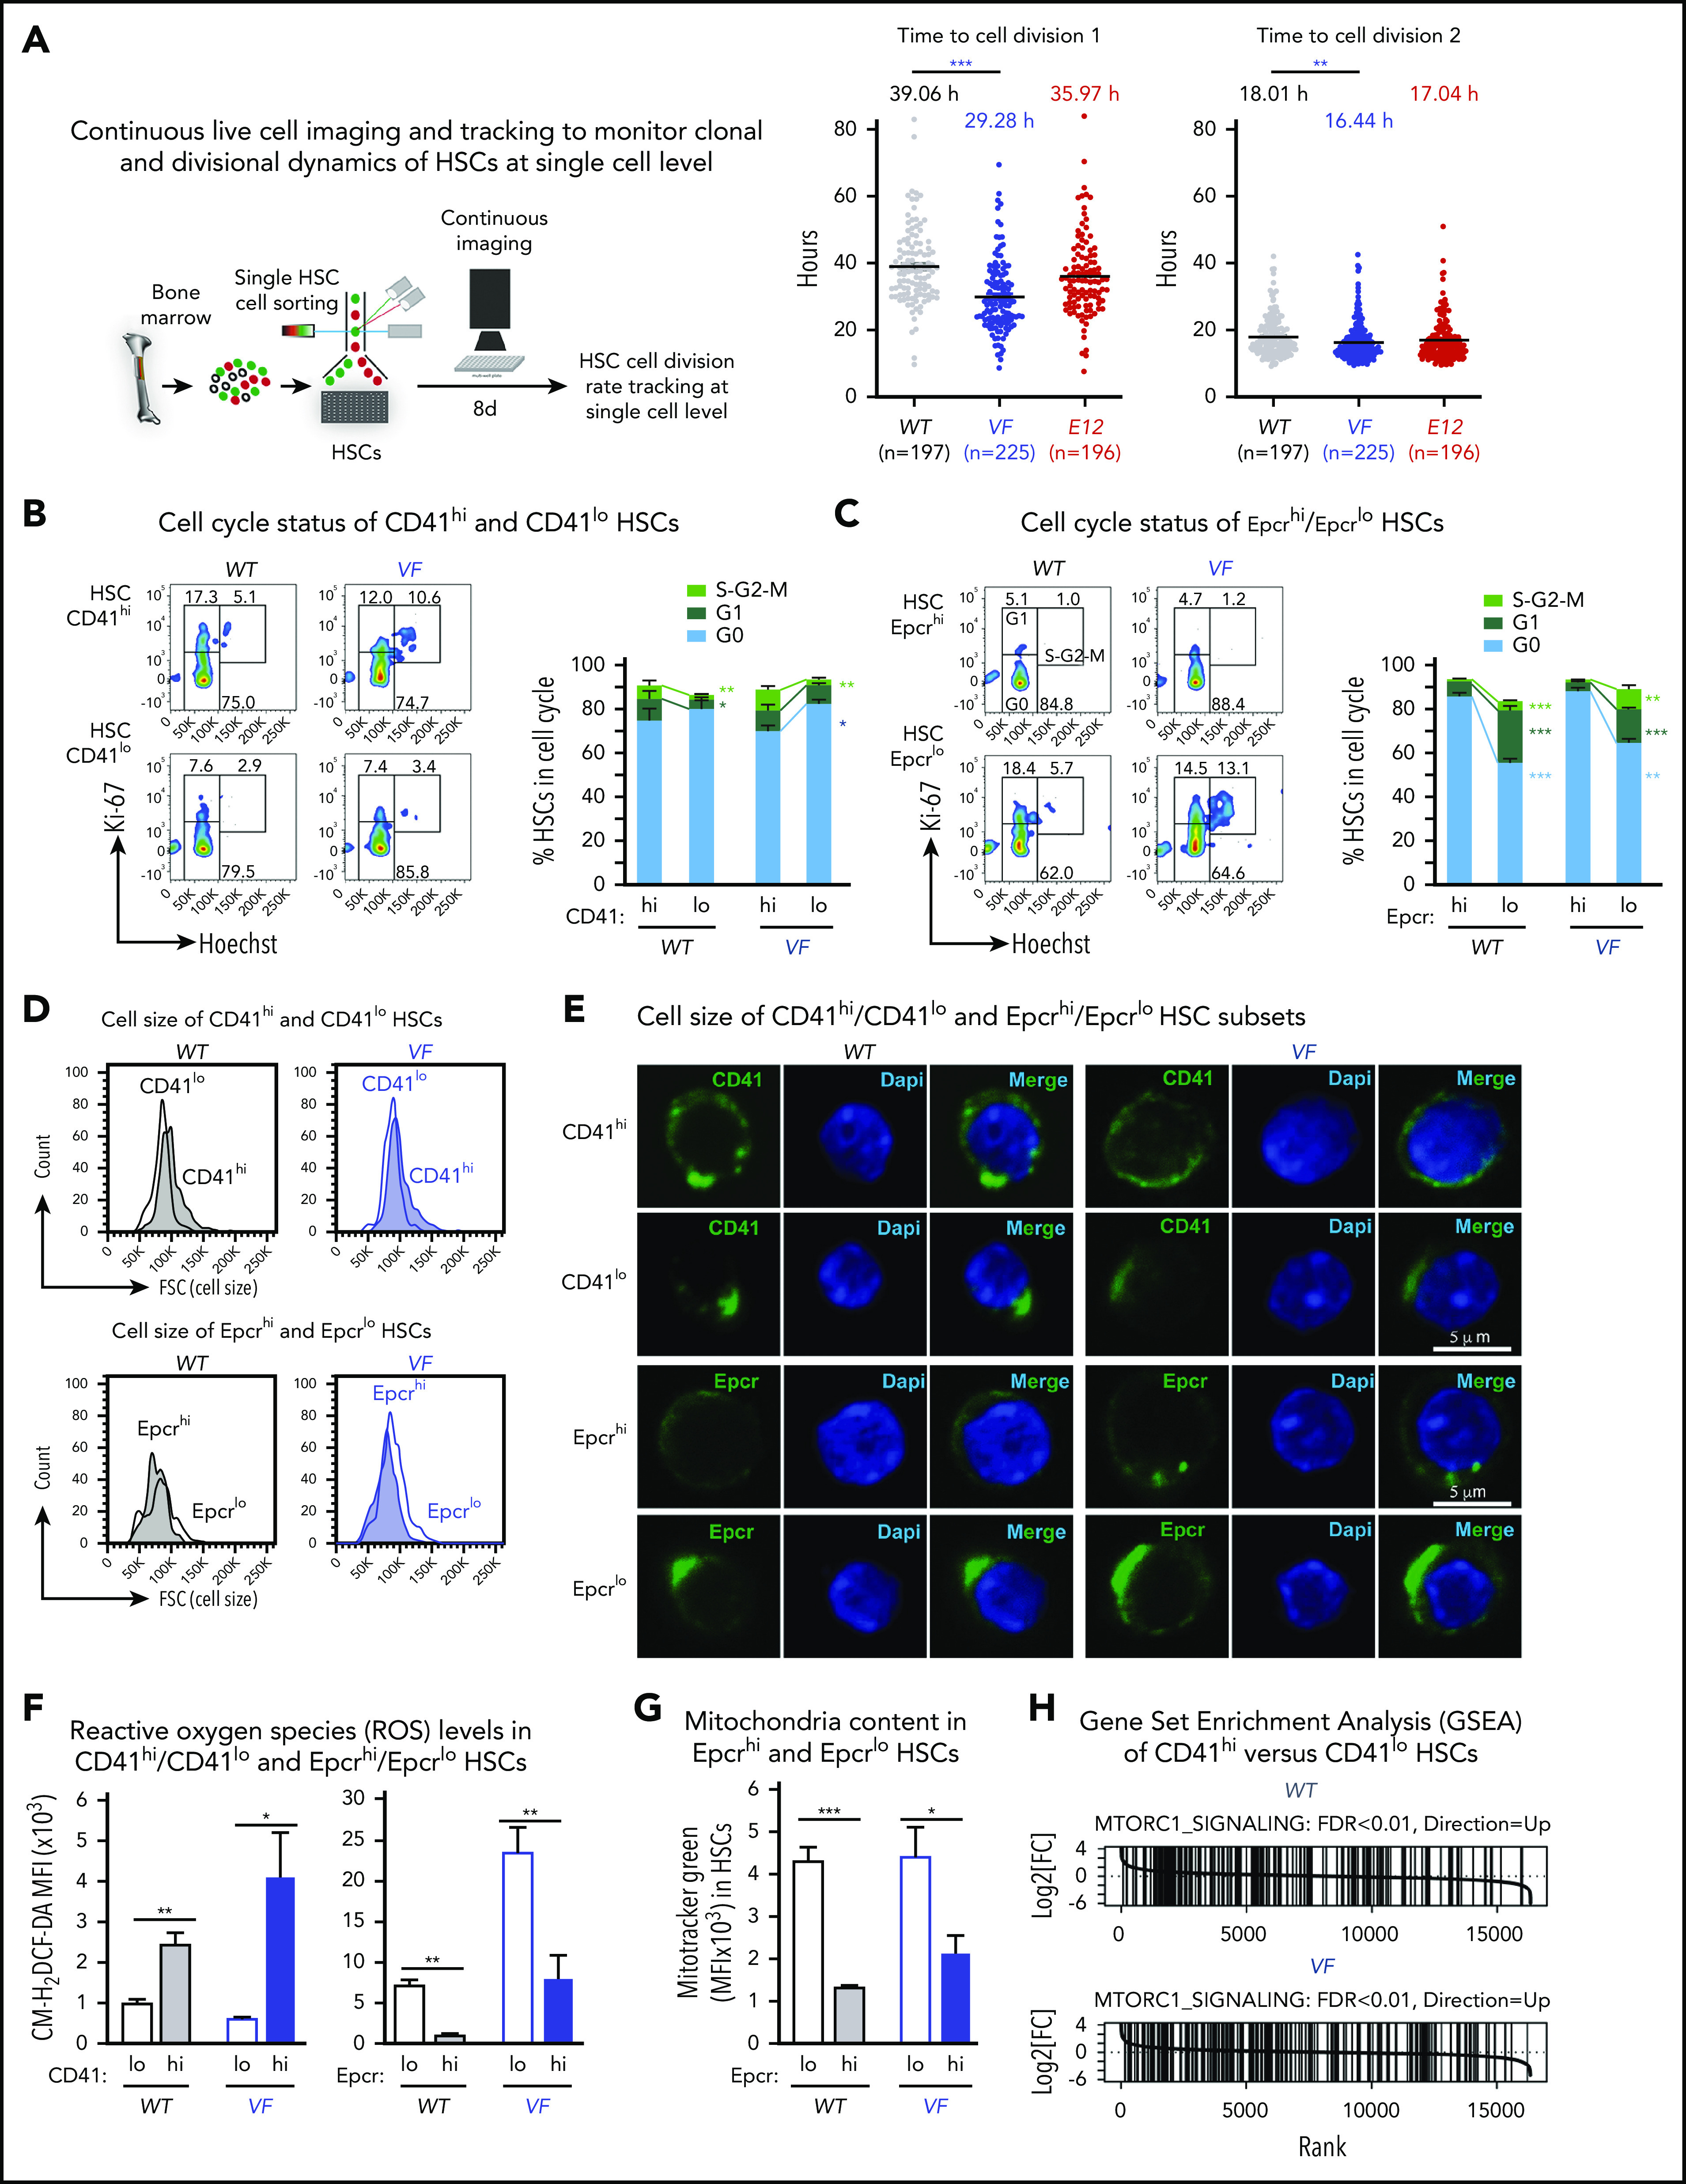
Figure 4.

CD41hi/EpcrloHSCs display enhanced cell cycle activity, increased mitochondrial content, and augmented mTOR signaling signature. (A) Experimental setup for measuring time to first cell division by single-cell tracking of sorted HSCs. (B,C) Dot plots show the time to the first and second cell divisions. Cell cycle status of CD41hi and CD41lo HSCs (B) and Epcrhi and Epcrlo HSCs (C). Increased percentage of Epcrlo and CD41hi HSCs reside in G1 and S phases (WT, n = 4 mice; VF, n = 7 mice). (D) Cell size of Epcrhi and Epcrlo HSCs (top) and CD41hi and CD41lo HSCs (bottom) assessed by the forward scatter parameter in flow cytometry (n = 6 mice per genotype). (E) Confocal microscopy of CD41lo and CD41hi HSCs and Epcrhi and Epcrlo HSCs revealed increased cell size of the Epcrhi and CD41lo HSC subsets. (F) ROS levels in Epcrhi/Epcrlo and CD41hi and CD41lo HSC subsets showing CM-H2DCF-DA mean fluorescence intensity (MFI; n = 6 mice per genotype). G) Mitochondria content in Epcrhi and Epcrlo HSCs detected with Mitotracker Green MFI (n = 6 mice per genotype). (H) GSEA of CD41hi and CD41lo HSCs showing increased expression of genes involved in mTOR signaling in CD41hi vs CD41lo HSCs (false discovery rate <.01). All data are means ± standard error of the mean. *P < .05; **P < .01; ***P < .001.
