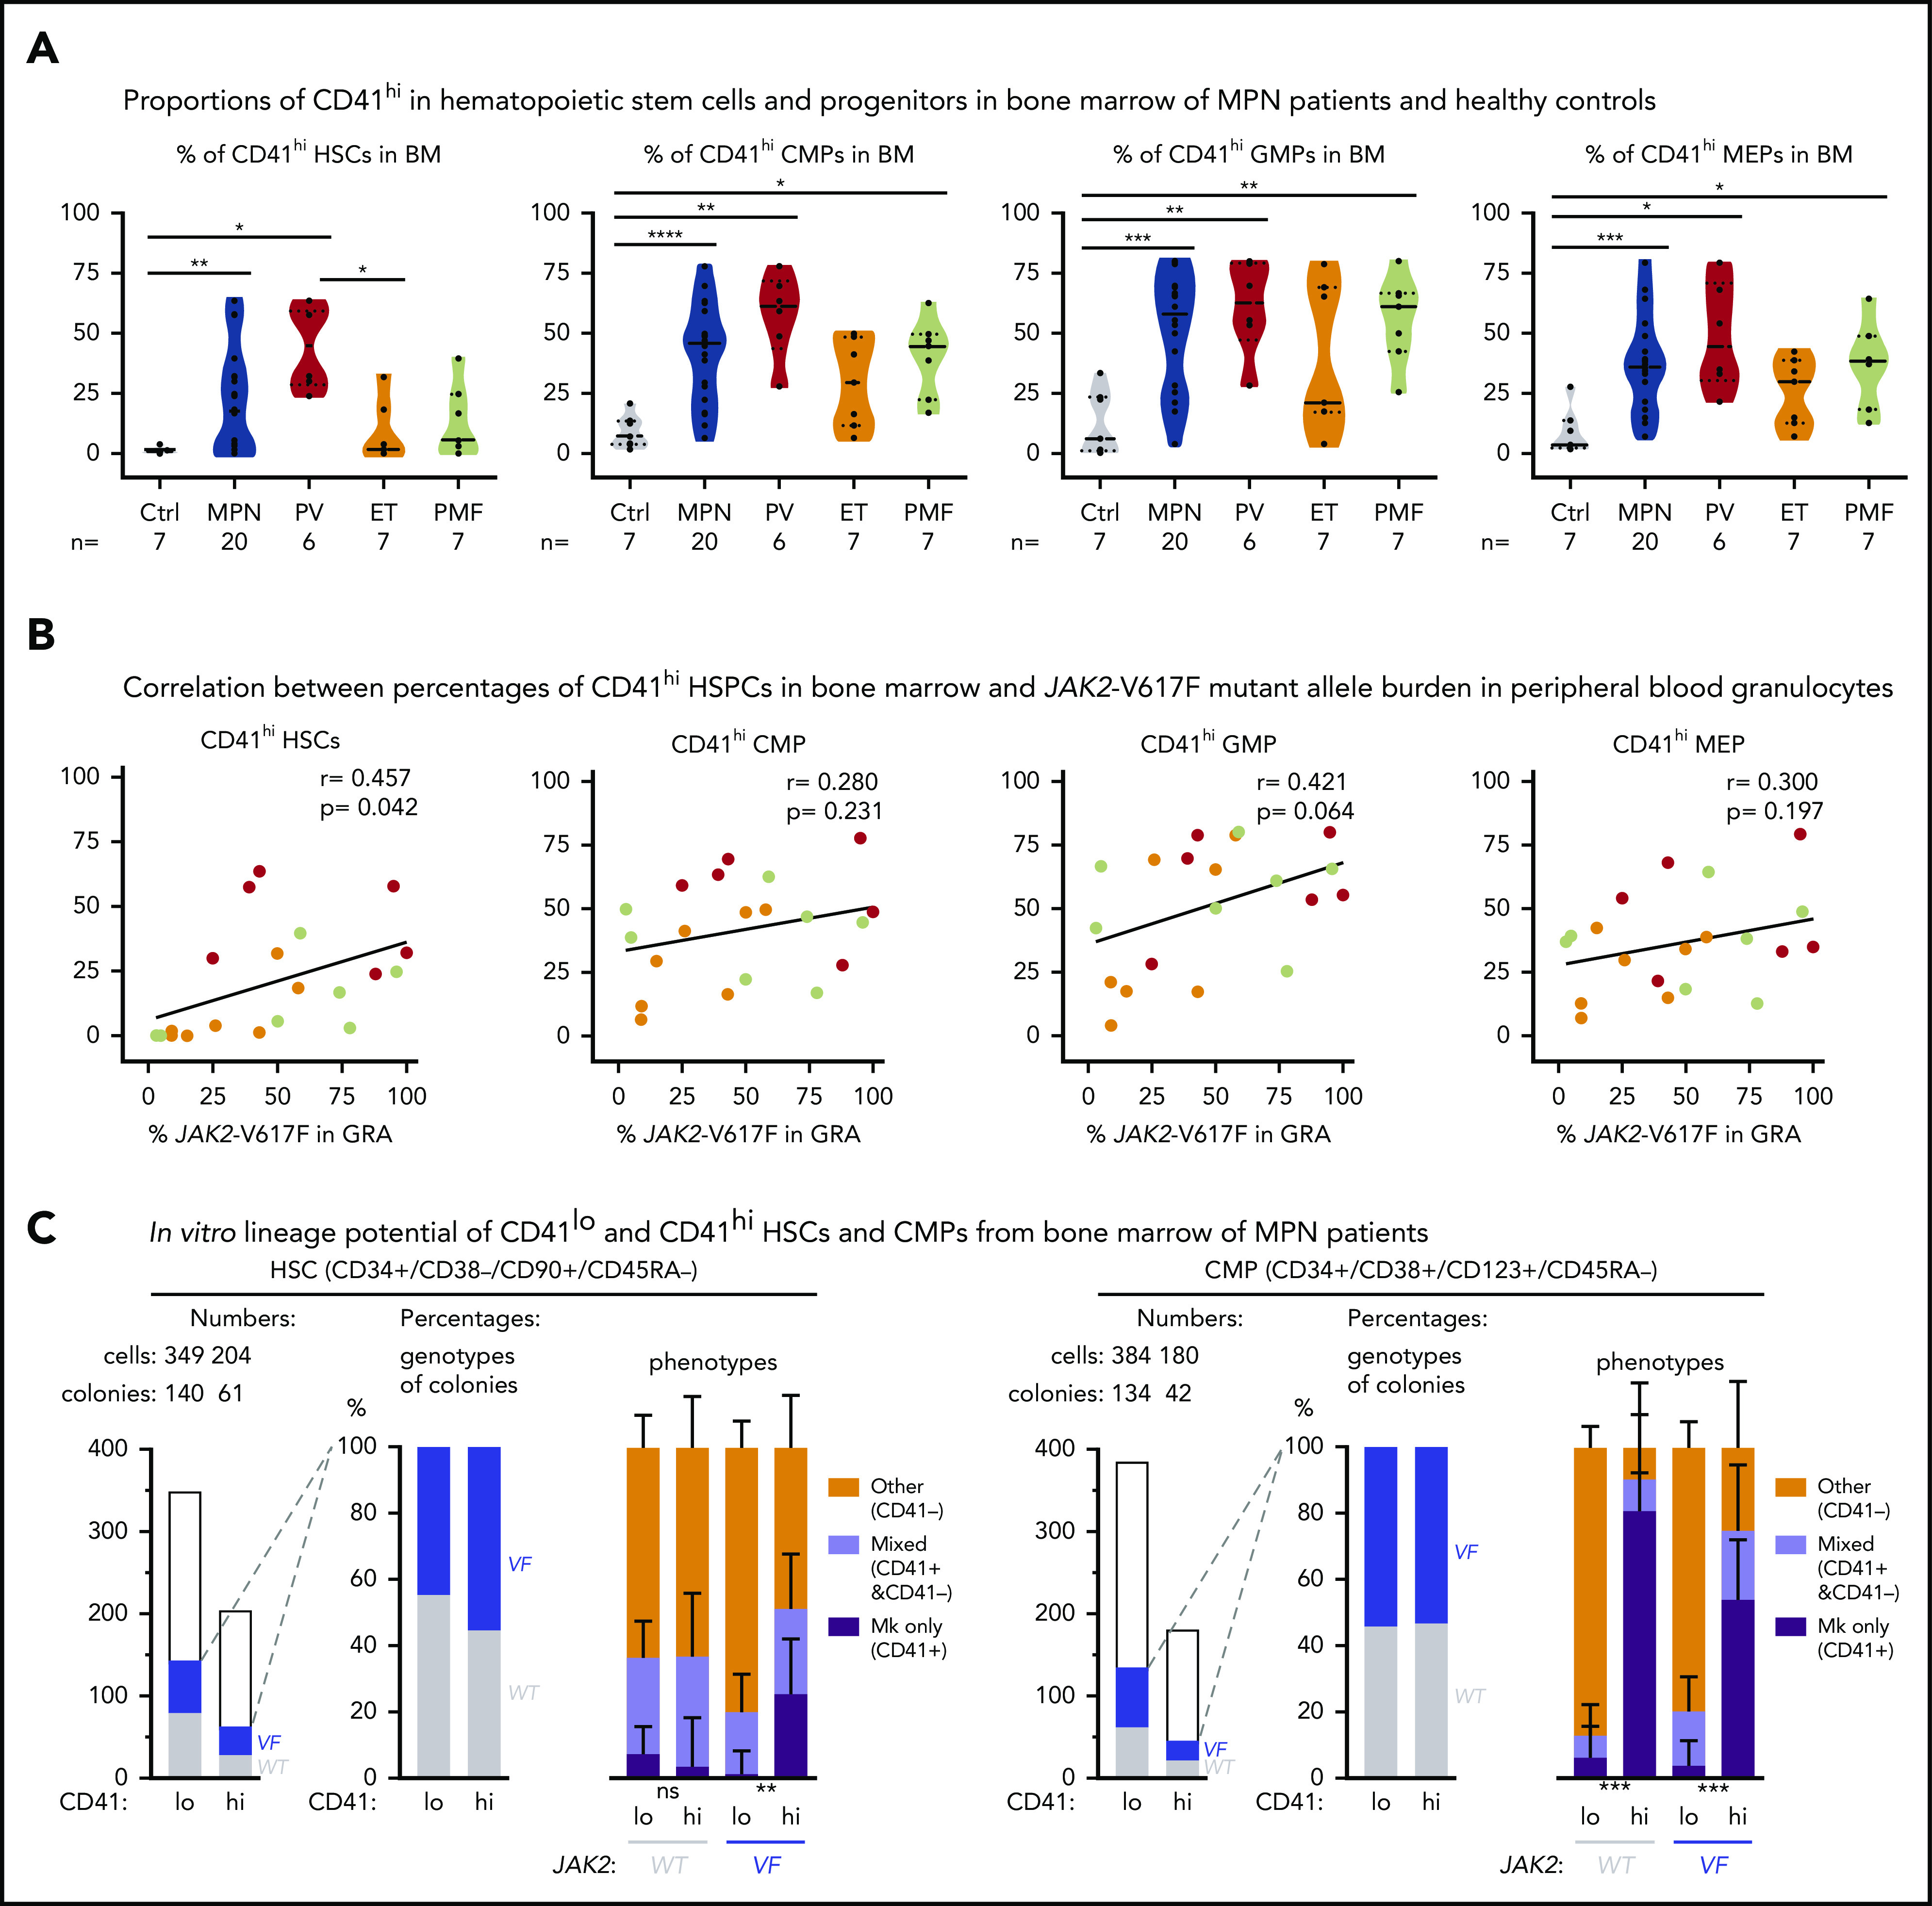
Figure 5.

Increased abundance of CD41+HSPCs in the BM of patients with MPN. (A) Violin plots showing percentages of CD41hi HSC, CMP, GMP, and MEP progenitor cells in the BM of controls (n = 7) and patients with MPN (n = 29). Unpaired t test with Welch’s correction. (B) Correlation (r, Pearson correlation) and significance (2-tailed Student t test) between mutant allele burden measured in PB granulocytes and percentages of CD41+ HSPCs in the BM were calculated and are shown for JAK2-V617F+ patients only. (r, Pearson correlation; P, 2-tailed Student t test). No correlation was observed in patients with the CALR mutation. (C) In vitro lineage potential of CD41lo and CD41hi HSCs and CMPs. FACS-sorted single cells were grown in 384-well plates, and, after 14 days of culture, colonies were first phenotyped inside the wells by CD41 antibody staining and live microscopy and then genotyped by allele-specific polymerase chain reaction (PCR)for JAK2-V617F. Combined data from 4 JAK2-V617F+ patients with MPN (2 PV and 2 PMF) are shown, along with the number of CD41lo and CD41hi single cells plated and the number of colonies with WT (gray) and JAK2-V617F (VF; blue) genotypes (left) and the percentages of VF vs WT colonies and the percentages of Mk colonies (all cells CD41+), mixed colonies (CD41+ and CD41− cells present in the same colony), and colonies with other phenotypes (all cells CD41− in the same colony) (right). Differences in lineage proportions between CD41lo and CD41hi populations were tested by Fisher’s exact test with the Hochberg correction for multiple testing. All data are means ± standard error of the mean; ns, not significant; *P < .05; **P < .01; ***P < .001; ****P < .0001.
