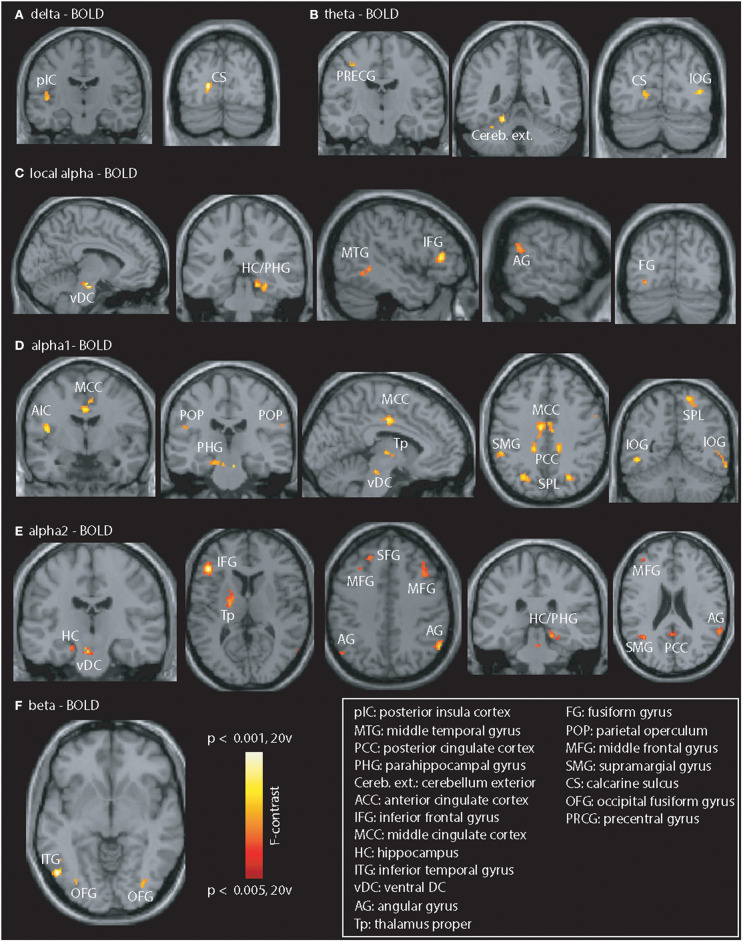
Figure 2.
Illustration of PiB-related EEG-fMRI signal coupling differences. Differences were seen in all frequency bands. (A,B) Delta / theta: posterior insular cortex (pIC), calcarine sulcus (CS), precentral gyrus (PRCG), cerebellum exterior (Cereb. ext.), and inferior occipital gyrus (IOG). (C–E) Local and GSP-based alpha: vDC, ventral DC; HC / PHG, hippocampus / parahippocampal gyrus; MTG, middle temporal gyrus; AG, angular gyrus; IFG, inferior frontal gyrus; FG, fusiform gyrus; AIC, anterior insular cortex; MCC, middle cingulate cortex; POP, parietal operculum; Tp, thalamus proper; PCC, posterior cingulate cortex; SPL, superior parietal lobe; MFG, middle frontal gyrus; SFG, superior frontal gyrus; SMG, supramarginal gyrus. (F) Beta: Coupling differences visible in the left ITG, and bilateral fusiform gyrus (OFG). Results are presented at p < 0.05 (cluster-corrected).

