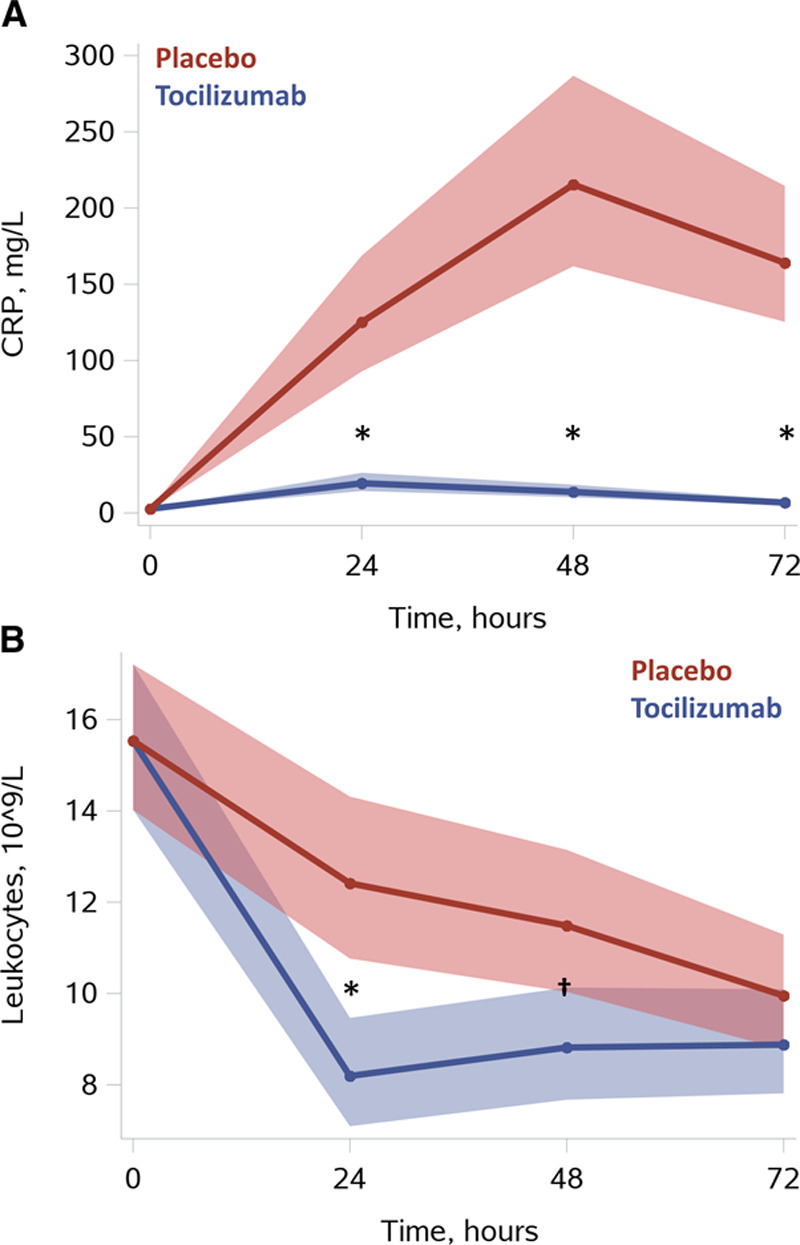
Figure 2.

Systemic inflammation. A, CRP. B, Leukocytes. Results are presented as means with [95% confidence limit] based on predicted values from linear mixed-model analysis with baseline correction (PROC MIXED, SAS Institute Inc). *P≤0.0001, †P=0.004 for tocilizumab vs placebo at corresponding time points using the interaction term “group*time.” For additional illustrations of observed values please see Figures I and II in the Data Supplement. CRP indicates C-reactive protein.
