Figure 4.

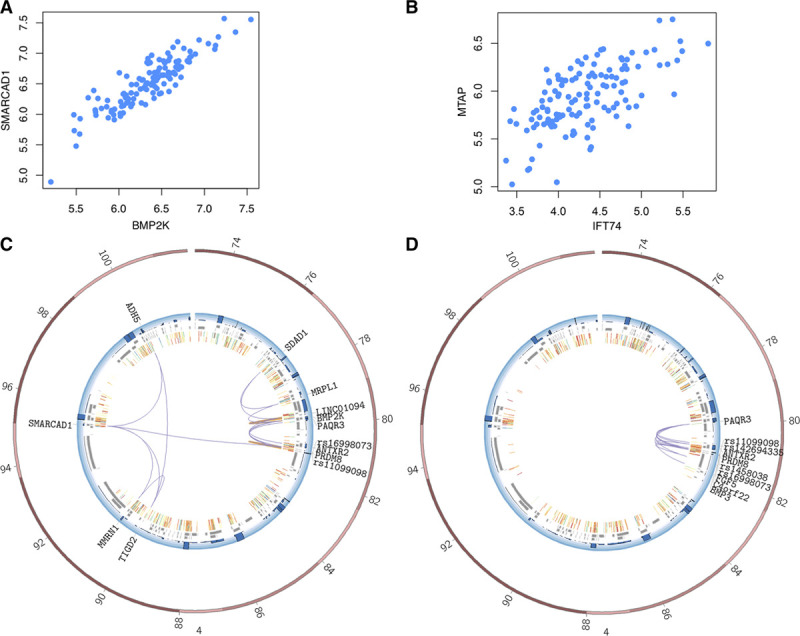
Expression levels of promoters interacting with the same variant were correlated. Expression correlation between (A) genes MTAP and IFT74 (P value 4.2×10⁻¹⁶) and (B) genes SMARCAD1 and BMP2K (P value 2.1×10⁻¹⁶) using aortic intima-media expression from 131 individuals. The values on axes are RPKM values, and each dot corresponds to each individual where both expression information are obtained from. C and D, Circos plot representation of interactions between rs16998073 and rest of the genome in C aortic endothelial cell (AEC) and D aortic smooth muscle cell for comparison. The plot spans chr4:73000000-103000000. The blue track represents gene expression levels, gray boxes represent transcripts, and innermost layers represent H3K27Ac marks in AEC cells (2 replicates). Purple arcs represent genome-wide association studies-promotor (Prom) or Prom-Prom, and orange arcs represent Prom-Distal interactions. BMP2K indicates BMP2 Inducible Kinase; BMP6, Bone Morphogenetic Protein; IFT74, Intraflagellar Transport 74; 6 MTAP, Methylthioadenosine Phosphorylase; RPKM, read counts per kilobase million; and SMARCAD1, SWI/SNF-Related, Matrix-Associated Actin-Dependent Regulator Of Chromatin, Subfamily A, Containing DEAD/H Box 1.
