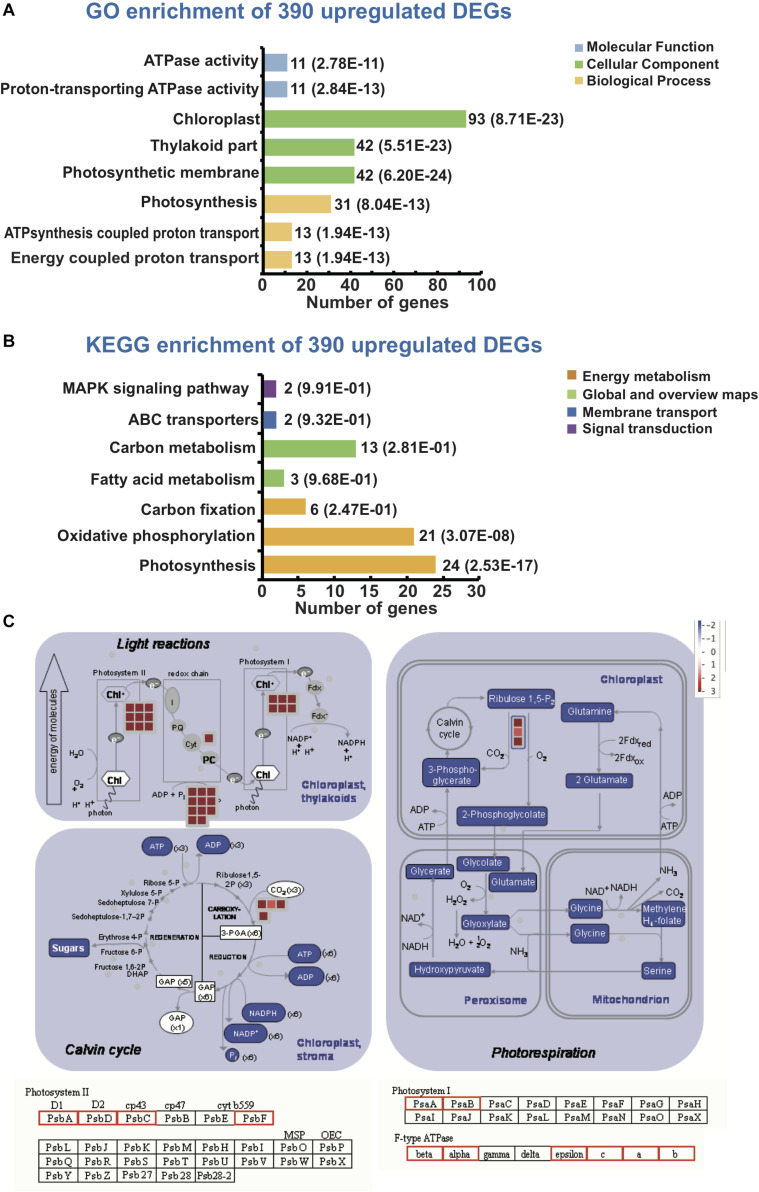
FIGURE 4.
Gene Ontology (GO) enrichment and KEGG pathway annotation of 390 upregulated pumpkin DEGs in leaves. (A) GO enrichment and (B) KEGG pathway analysis of 390 upregulated pumpkin DEGs in leaves. Colored graphs indicate the classifications of molecular function, cellular component and biological process. The numbers beside each graph represent the number of genes in the cluster and the P-value. (C) Pathway of photosynthetic metabolism for the 390 upregulated pumpkin DEGs in leaves. The boxes indicate the various metabolites encoded by the upregulated DEGs in leaves after 6 h cold treatment compared with those in the 0 h treatment. The FIGURE was sourced from “Photosynthesis” in Mapman (MapManInst-3.5.1R2).

