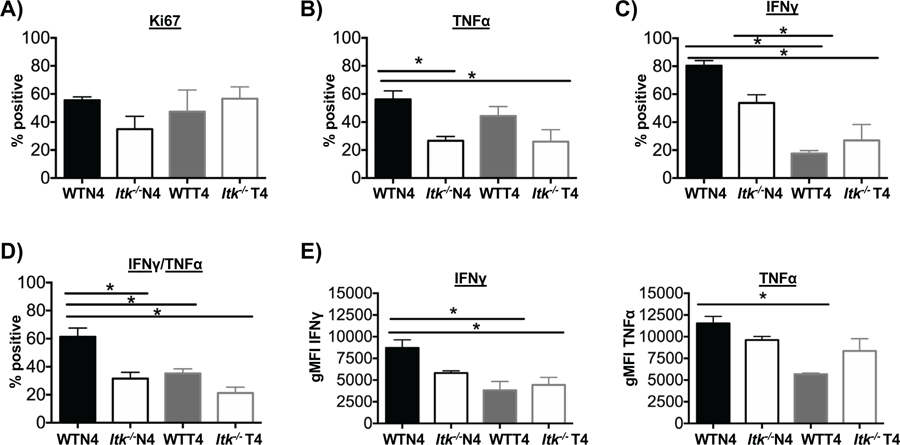
Figure 3. TcR signal strength and antigen affinity regulate effector cell response and cytokine production upon reinfection.

Recipients of WT or Itk−/− cells were infected with LM-N4 or LM-T4, followed by secondary infection with 5×10⁶ CFU of LM-N4 on day 37. Seven days after secondary infection splenocytes were harvested from each group and donor cells analyzed. (A) Cell proliferation was determined by staining for Ki67. Percentage of single TNFα, IFNγ, and double producers of TNFα+ and IFNγ+ (B-D). MFI of IFNγ and TNFα analyzed (E). *p<0.05 and n.s. = “Not Significant” based upon one-way ANOVA. Data (mean ± SEM) is representative of two independent experiments with n ≥ 3–4. n=4 in WT and Itk−/− group receiving LM-N4; n=3 for WT group receiving LM-T4; n=4 for Itk−/− group receiving LM-T4.
