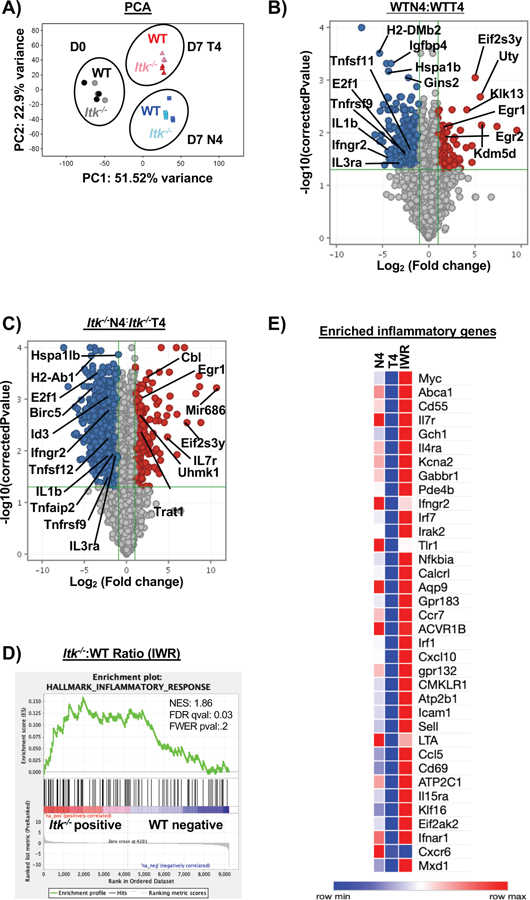
Figure 4. Infection and antigen affinity drive the largest changes in transcriptome of responding CD8+ T cells.

Naïve CD8+ T cells were sorted from spleens of OT-1/ Rag−/− (WT) or Itk−/−/OT-1/Rag−/−/ (Itk−/−) mice for RNA-sequencing on D0. Three biological replicates were used for WT and Itk−/− groups. For D7 analysis, donor CD8+ T cells were isolated from spleens and sorted (CD45.2+CD45.1−) on D7 post infection with LM-expressing N4 or LM-expressing T4 OVA peptide. Three technical replicates were used for each condition. Principal component analysis was performed on all three conditions with a log2 fold change and p<0.05 (A) with PC3 at 5.96% and PC4 at 4.01%. (B) Volcano plot of significantly up and down-regulated genes under high (N4) and low (T4) antigen affinity condition and (C) under differential TcR signal strength based on log2 fold change. (D) The ratio of the log transformed values for Itk−/− N4: Itk−/− T4 to WTN4:WTT4 were calculated (referred to as IWR). GSEA revealed that the inflammatory response was significantly upregulated in the Itk−/− cells compared to WT cells. (E) Custom heatmap displaying the enriched inflammatory response genes compared to other conditions: N4 (Itk−/−:WT cells infected with LM-N4), T4 (Itk−/−:WT cells infected with LM-T4) was generated.
