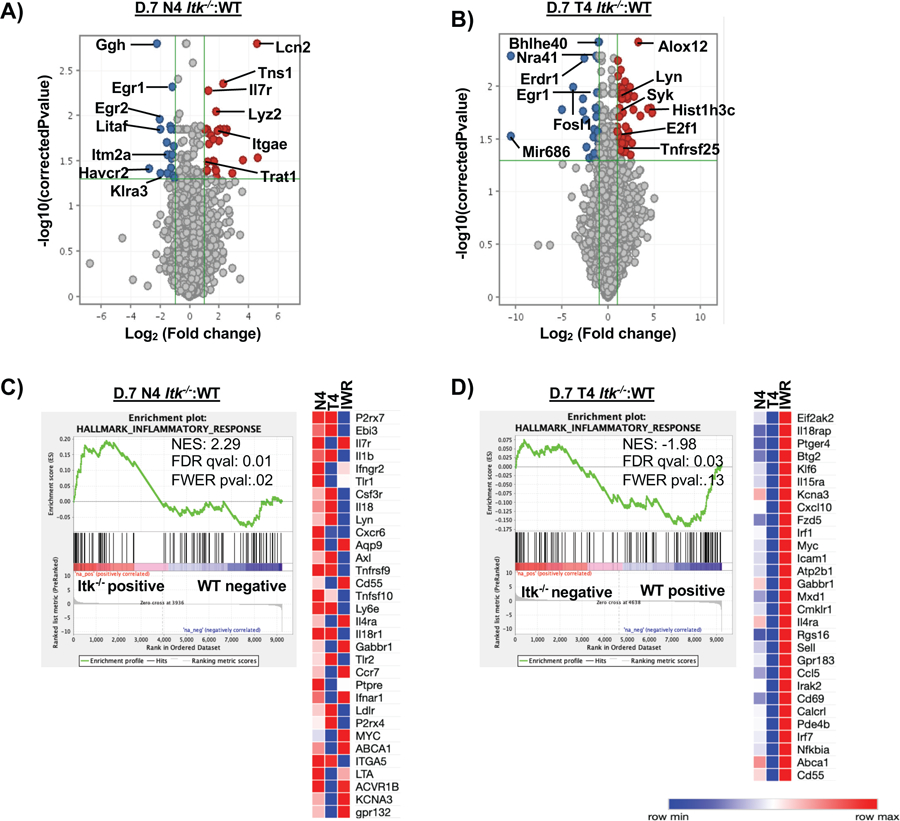
Figure 5. Transcriptome analysis reveals changes in cytokine and metabolic gene-sets driven by difference in TcR signal strength and antigen affinity.

(A) Volcano plot (not all genes shown) comparing the Itk−/− to WT cells infected with LM-N4. (B) Volcano plot (not all genes shown) comparing the Itk−/− cells to the WT cells infected with LM-T4. (C) GSEA revealed that the inflammatory response was significantly upregulated in Itk−/− cells responding to the high affinity infection on D7 compared to WT D0 cells. A custom heatmap of the enriched inflammatory genes was created and compared to the N4 (Itk−/− :WT cells infected with LM-N4), T4 (Itk−/−:WT cells infected with LM-T4), and IWR conditions. (D) GSEA revealed that the inflammatory response was significantly downregulated in Itk−/− cells responding to the low affinity antigen condition compared to WT D0 cells; a custom heatmap of the enriched inflammatory genes was created and compared to the same conditions listed above.
