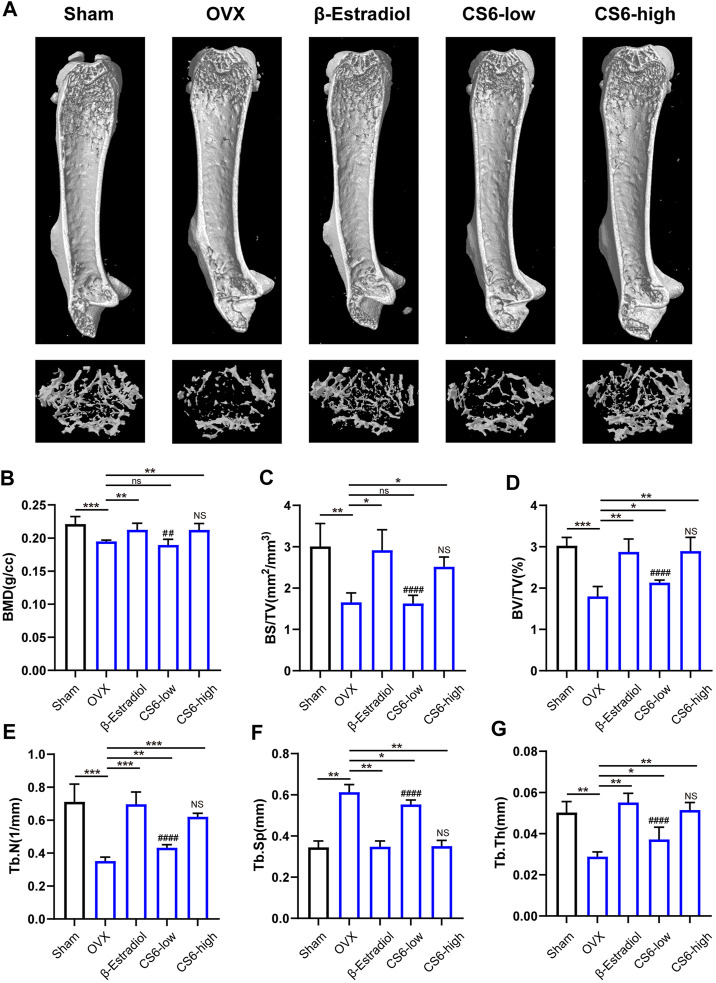
FIGURE 7.
Validation of the biological effect of CS-6 on osteoclastic bone resorption in systemic OVX-induced bone loss in vivo indicated by microstructure analysis. (A) Representative three-dimensional images of μCT for mouse femur from the sham group (mock operation with DMSO injection), OVX group (OVX with DMSO injection), positive group (OVX with β-estradiol injection, 5 mg/kg), low-dose group (OVX with low-dose CS-6, 0.5 mg/kg), and high-dose group (OVX with high-dose CS-6, 2.5 mg/kg). (B–E) Quantitative analyses of bone structural parameters, including trabecular bone mineral density (BMD, g/cc), bone surface area/total volume (BS/TV; %), bone volume/total volume (BV/TV; mm−1), trabecular number (Tb.N; mm−1), trabecular spacing (Tb.Sp, mm), and trabecular thickness (Tb.Th, mm) within the selected metaphyseal region were shown in the charts. Values were presented as the mean ± standard deviation (n = 5); *p < 0.05, **p < 0.01, ***p < 0.001, ****p < 0.0001. # and NS indicated the comparison between the sham group and CS-6 treatment group, #p < 0.05, p < 0.01, p < 0.001, p < 0.0001.

