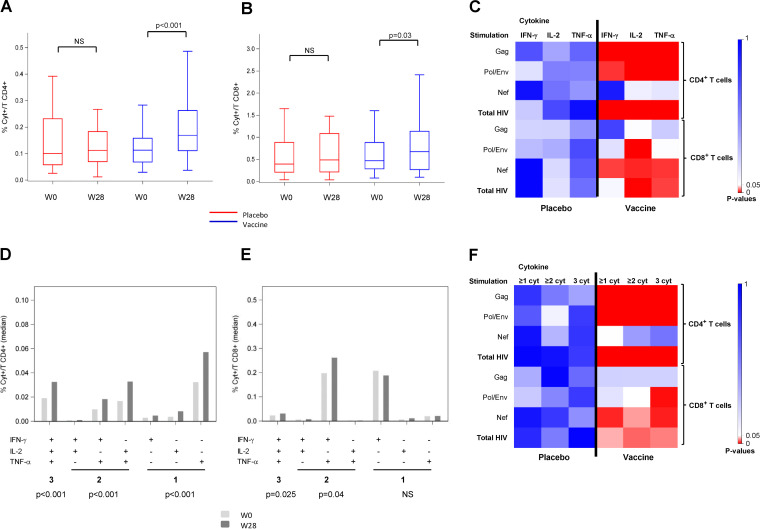
FIG 2.
Functional profile of CD4+ and CD8+ T-cell responses. Production of interleukin 2 (IL-2), gamma interferon (IFN-γ), and tumor necrosis factor alpha (TNF-α) as measured by intracellular cytokine staining (ICS) using multiparametric flow cytometry after cell stimulation before (W0) and after vaccination (W28) in placebo (red) and therapeutic vaccine (blue) groups. (A) HIV-specific CD3+ CD4+ T-cell frequency; (B) HIV-specific CD3+ CD8+ T-cell frequency; (C) heatmap of P values between W28 and W0 of CD3+ CD4+ and CD3+ CD8+ marginal responses against Gag, Pol/Env, Nef, and the sum of HIV peptides (total HIV); (D) frequency of HIV-specific CD3+ CD4+ T cells producing 1, 2, or 3 cytokines in the vaccine group at W0 (light gray) and W28 (dark gray); (E) frequency of HIV-specific CD3+ CD8+ T cells producing 1, 2, or 3 cytokines in the vaccine group at W0 (light gray) and W28 (dark gray); (F) heatmap of P values between W28 and W0 of CD3+ CD4+ and CD3+ CD8+ polyfunctionality responses against Gag, Pol/Env, Nef, and total HIV peptides.

