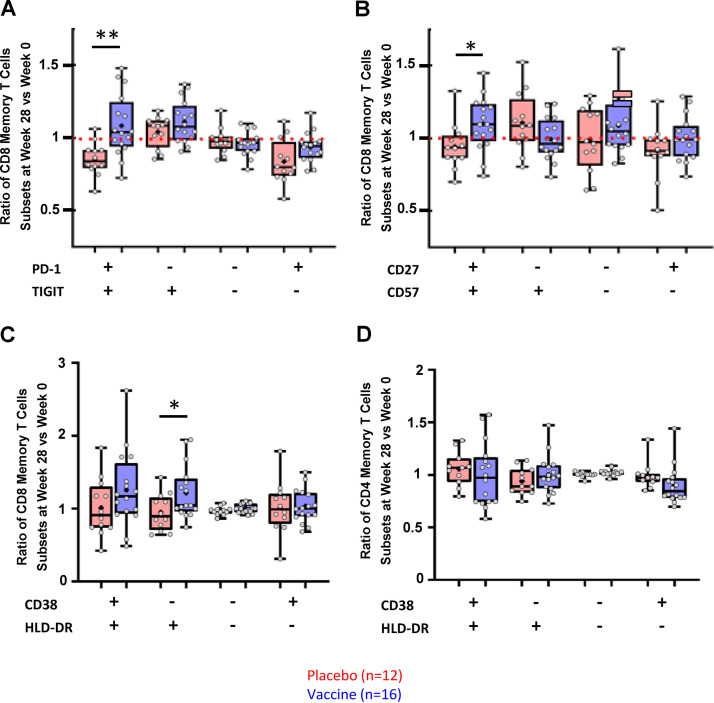
FIG 3.
Mass cytometry (CyTOF) phenotyping. Ratio of memory CD8+ T cells at W28 compared to W0 for several subsets according to PD-1 and TIGIT (A), CD27 and CD57 (B), or HLA-DR and CD38 (C) in placebo (red) and therapeutic vaccine (blue) groups. Ratio of memory CD4+ T cells at W28 compared to W0 for HLA-DR and CD38 (D) in placebo (red) and therapeutic vaccine (blue) groups. P values were calculated using the Mann-Whitney test; *, P = 0.017; **, P = 0.0022.

