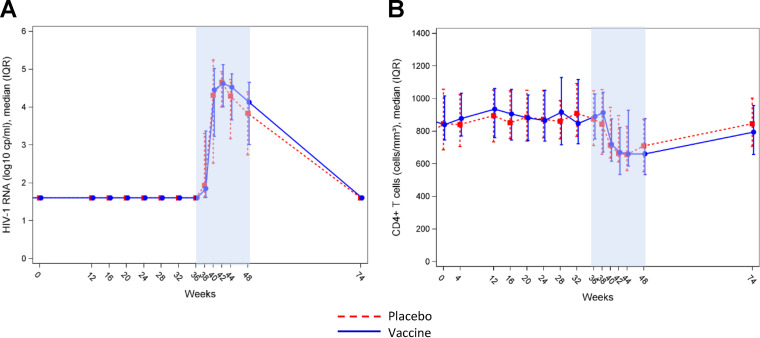
FIG 4.
Plasma HIV viral load and CD4+ T-cell count changes throughout the study. (A) Levels of plasma HIV RNA in the placebo (red) and therapeutic vaccine (blue) groups before and after ATI (weeks 36 to 48); (B) CD4+ T-cell count changes during the vaccination phase and following ATI in the placebo (red) and therapeutic vaccine (blue) groups before and after ATI (weeks 36 to 48).

