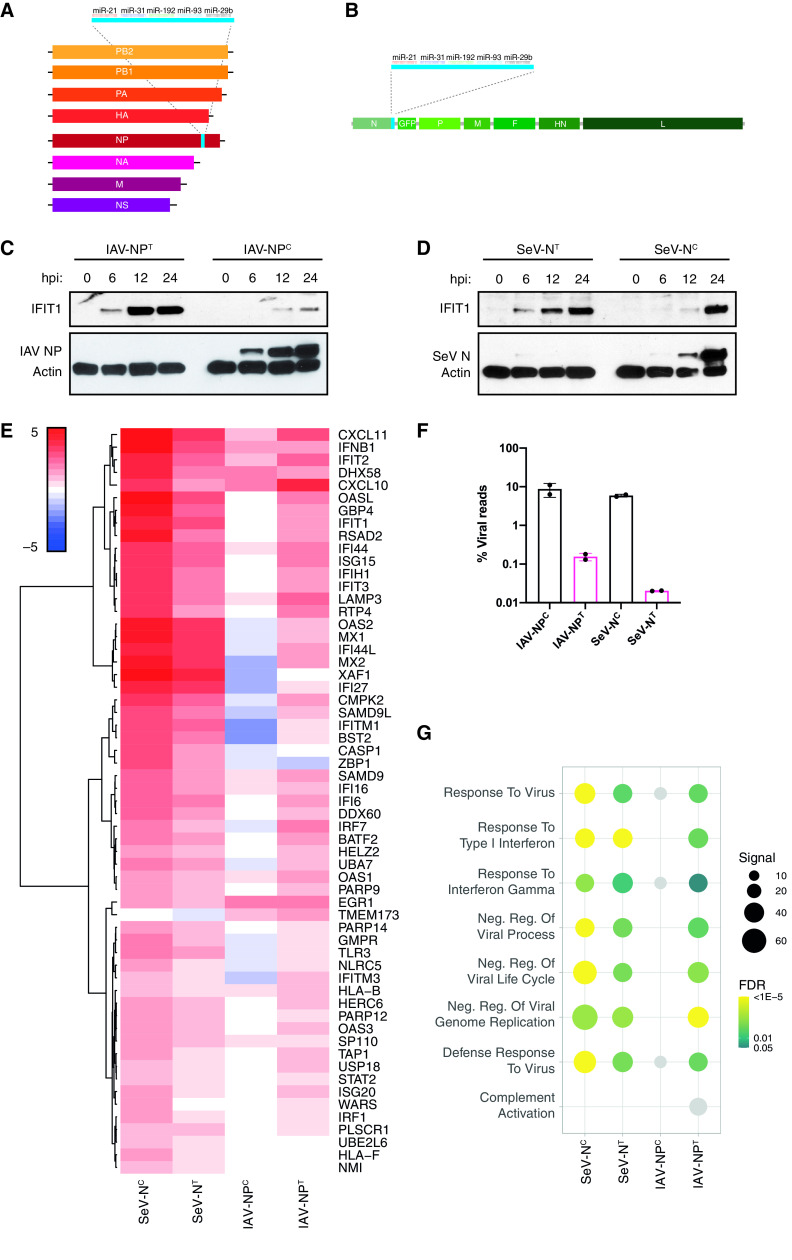
FIG 1.
Inhibiting NP expression induces an antiviral host immune response. (A) Schematic of the recombinant influenza A virus genome containing the miRNA-targeting cassette downstream of the NP open reading frame (ORF). (B) Schematic of the recombinant Sendai virus genome containing the miRNA-targeting cassette downstream of the N ORF. A GFP ORF is also inserted between the N and P ORFs. (C) Western blot analysis for IAV NP, IFIT1, and actin of whole-cell lysates of A549 cells infected with IAV-NPC or IAV-NPT at an MOI of 5 for 0, 6, 12, or 24 h. (D) Western blot analysis for SeV N, IFIT1, and actin of whole-cell lysates of A549 cells infected with SeV-NC or SeV-NT at an MOI of 5 for 0, 6, 12, or 24 h. (E) Heat map analysis of the log2(fold change) expression levels of differentially expressed genes involved in the IFN-I response compared to mock-infected cells after bulk mRNA-seq analysis of IAV-NPC/IAV-NPT (MOI of 5; 9 hpi)- or SeV-NC/SeV-NT (MOI of 5; 24 hpi)-infected A549 cells. (F) Mean percentage of viral reads over total mapped reads. (G) Dot plot visualization of enriched GO terms after RNA-seq analysis. Gene set enrichment analysis (GSEA) was performed against the GO data sets for biological processes. The color of the dots represents the false discovery rate (FDR) value for each enriched GO term. The size of the dots represents the enrichment signal strength (as a percentage) of genes included in the complete gene set. Light gray dots represent nonsignificant enrichments (FDR ≥ 0.05).

