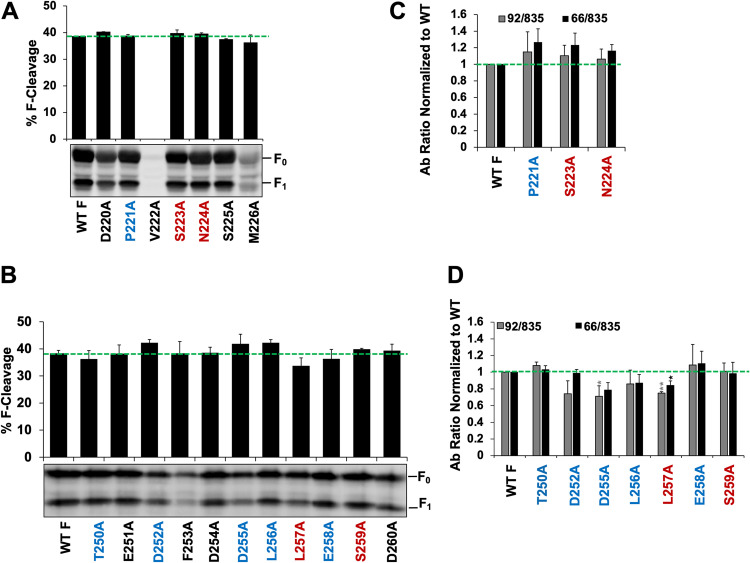
FIG 3.
Levels of F processing and relative overall NiV F mutant prefusion conformations. (A and B) Levels of F processing determined by quantitative Western blotting (using detection of fluorescent antibodies) of cell lysates from NiV F N1 mutants (A) or (B) NiV F N4 mutants. Levels of processing were determined by dividing the F1 signal by total F0 + F1 in cell lysates. The average from three experiments is shown, with error bars indicating the standard error of the mean. Lack of statistically significant differences was determined by two-sample Student's t test. A representative image of total cell lysates is shown. (C and D) Relative levels of MAb 92 and 66 binding of wild-type NiV F or N1 region mutants (C) or (D) N4 region mutants, all normalized to those of wild-type NiV F. All antibody binding levels were normalized to the CSE of each N1/N4 NiV F (as measured by PAb 835 binding). n = 3. Statistically significant differences, as determined by a one-sample Student's t test, are marked with asterisks: *, P ≤ 0.05; **, P ≤ 0.01.

