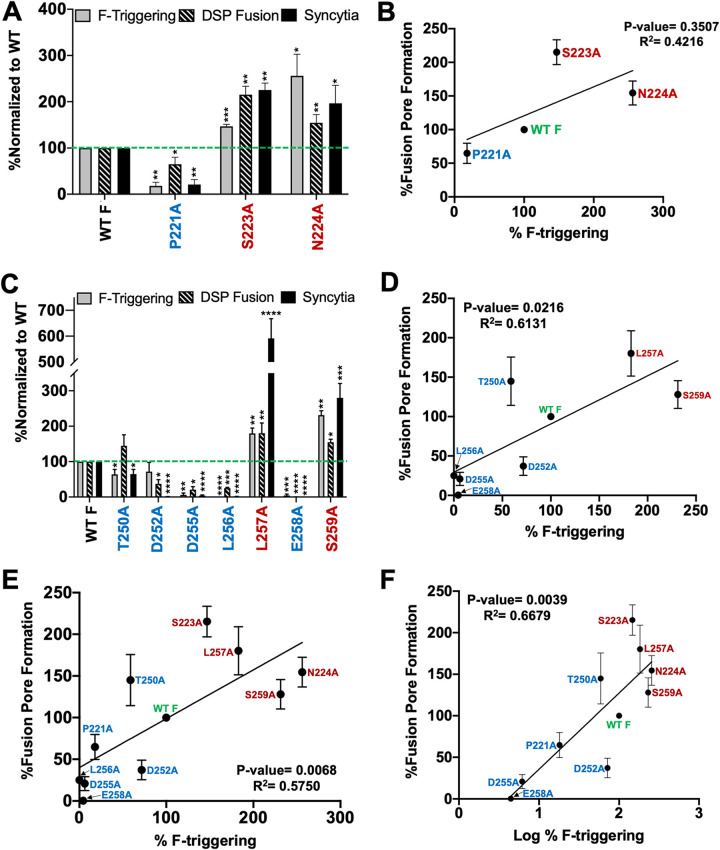
FIG 4.
Positive correlation between F-triggering and fusion pore formation for the NiV F N1 and N4 region fusion mutants. (A and C) Levels of F-triggering and fusion pore formation of select NiV F N1 and N4 regions mutants compared to wild-type F in HEK 293T cells. F-triggering levels were determined by flow cytometry using a Cy5-labeled HR2 peptide and normalized to CSE levels for each mutant. Dual split protein fusion assay results (fusion pore formation) were normalized to wild-type NiV F. Levels of F-triggering, DSP fusion, and syncytium formation (from Fig. 2A) are shown together to better illustrate the step(s) of fusion affected. The data shown are averages from at least 3 experiments, with error bars indicating standard error of the mean. Statistically significant differences, as determined by a one-sample Student's t test, are marked with asterisks: *, P ≤ 0.05; **, P ≤ 0.01; ***, P ≤ 0.001; and ****, P ≤ 0.0001. (B) Percentage of fusion pore formation plotted against percentage of F-triggering from panel A. (D) Percentage of fusion pore formation plotted against percentage of F-triggering from panel C. (E) Percentage of fusion pore formation plotted against percentage of F-triggering of both N1 and N4 mutants from panels A and C. (F) Percentage of fusion pore formation plotted against log percentage of F-triggering of both N1 and N4 mutants from panels A and C. Note that the L256A mutant was excluded from the analysis as the log of 0% F-triggering is undefined.

