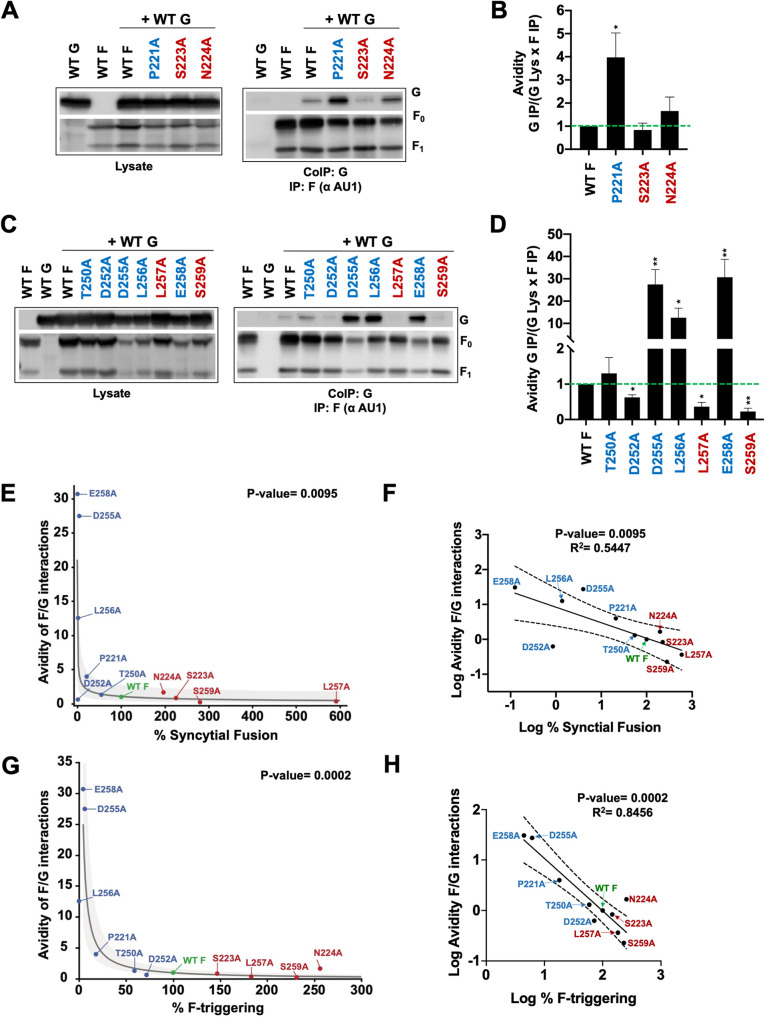
FIG 7.
NiV-G associations are altered for some NiV F N1 and N4 fusion mutants. (A) Cell lysates (left) transfected with wild-type NiV G and NiV F (wild type or N1 region mutants) and co-IP (right). NiV F was pulled down using protein G coupled with rabbit anti-AU1. Associated NiV G was coimmunoprecipitated. (B) N1 mutant F/G co-IP values (relative avidities) were determined by dividing G IP by (G Lys × F IP), as previously performed to account for G and F expression and F IP capabilities (38, 49, 58, 63). Avidity values were normalized to wild-type NiV F. The average from six experiments is shown, with error bars indicating the standard error of the mean. Statistically significant differences, as determined by a one-sample Student's t test, are marked with an asterisk: *, P ≤ 0.05. (C) Cell lysates (left) transfected with wild-type NiV G and NiV F (wild type or N4 region mutants) and co-IP (right), similarly to panel A. (D) Avidities of F-G interactions for N4 mutants were determined by dividing G IP by (G Lys × F IP) and normalized to wild-type NiV F. The average from five experiments is shown, with error bars indicating the standard error of the mean. Statistically significant differences, as determined by a one-sample Student's t test, are marked with asterisks: *, P ≤ 0.05; **, P ≤ 0.01. (E) F-G interaction avidities plotted against percentage of syncytial fusion for the N1 and N4 region mutants. The gray line is the log transformation fit to the data, and the shaded area is the 95% confidence interval for the fit. (F) Plot of log avidity versus log percentage of syncytial fusion for N1 and N4 region mutants with 95% confidence interval for the fit. (G) F-G interaction avidities plotted against percentage of F-triggering for the N1 and N4 region mutants. The gray line is the log transformation fit to the data, and the shaded area is the 95% confidence interval for the fit. (F) Plot of log avidity versus log percentage of F-triggering for the N1 and N4 region mutants with 95% confidence interval for the fit.

