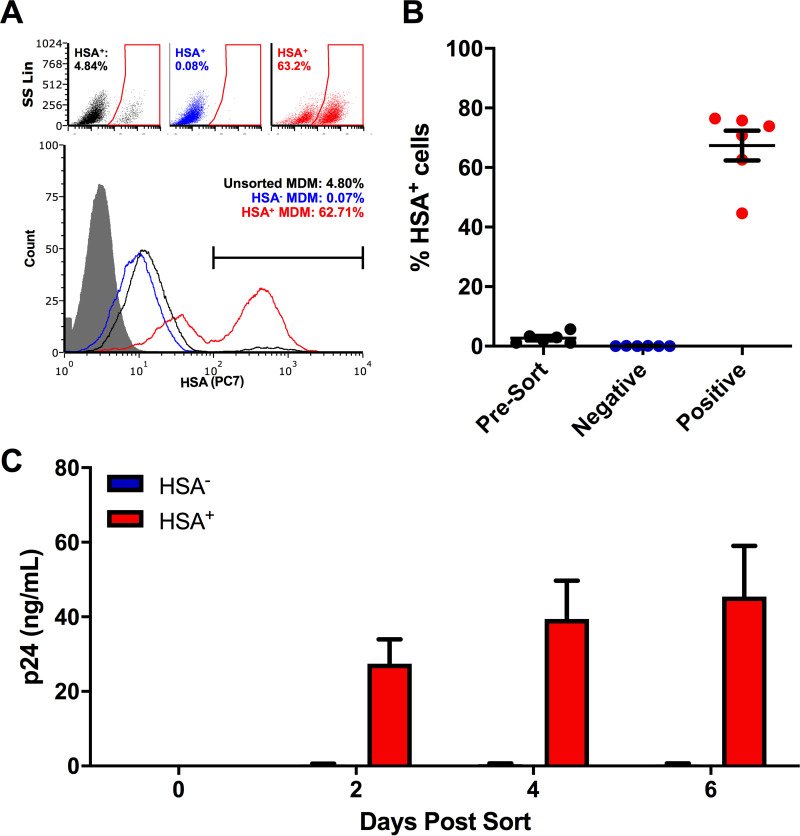
FIG 1.
Enrichment of HSA+ MDM. (A) Representative dot plots and histogram showing the frequency of HSA+ MDM presort (black), as well as within the HSA-negative (blue) and HSA-enriched (red) cell fractions. The HSA isotype control is shown in gray. Histogram peak counts (y axis) were normalized to that of the isotype control for visualization purposes. SS Lin, side scatter, linear scale. (B) Purity of HSA-enriched MDM fraction postsort (n = 6). (C) HIV-1 p24 antigen release by enriched HSA+ and HSA− MDM (n = 4). Data represent mean ± standard error of the mean (SEM); n values represent separate biological replicates.

