FIG 2.
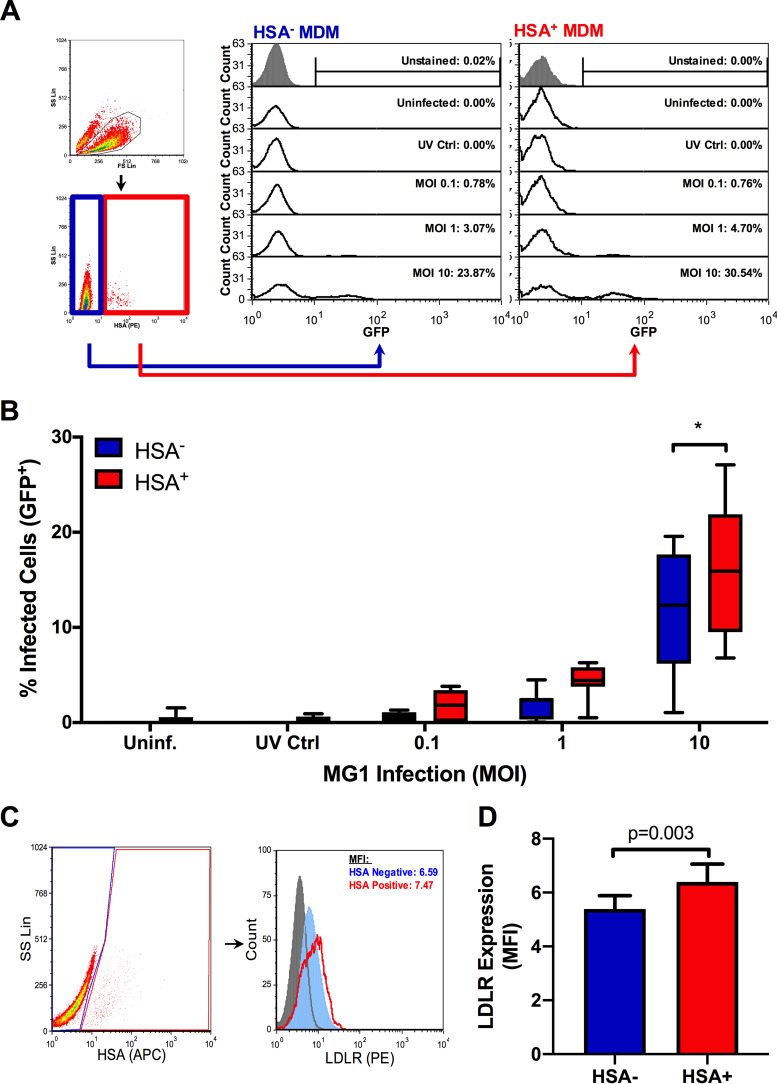
MG1 preferentially infects HSA+ MDM. At 6 days post-HIV-1 infection, MDM cultures were infected with MG1 or left uninfected. UV-inactivated MG1 was included as an additional experimental condition (UV Ctrl.). UV-inactivated viral particles were added to MDM cultures at a ratio of 10:1, as calculated from pre-UV inactivation virus titers. At 48 h post-OV infection, frequencies of HSA+ and GFP+ MDM were measured by flow cytometry. (A) Example of gating strategy employed during data analysis. Intact cells were analyzed (black gate), after which HSA− (blue gate) and HSA+ (red gate) MDM were gated upon. The percentages of GFP+ cells were then measured within HSA+ and HSA− populations, as shown in representative histograms. Histogram peak counts (y axis) for HSA− and HSA+ populations were normalized to that of the uninfected control for visualization purposes. (B) Frequencies of GFP+ cells within HSA+ and HSA− MDM populations at 48 h post-MG1 infection (n = 7; P < 0.0001 by 2-way repeated-measures ANOVA; *, P < 0.001 by Bonferroni posttest). (C) Flow cytometry gating strategy and representative histograms depicting LDLR expression on HSA− (blue) and HSA+ (red) MDM. Intact cells were gated (black), after which HSA− (blue) and HSA+ (red) MDM were defined. The PE FMO control is shown as a filled, gray peak. Histogram peak counts (y axis) for HSA− and HSA+ populations were normalized to that of the PE FMO control for visualization purposes. (D) LDLR expression on HSA− (blue) and HSA+ (red) MDM (n = 7; P = 0.003 by paired, two-tailed t test). Data represent mean ± SEM; n values represent separate biological replicates.

