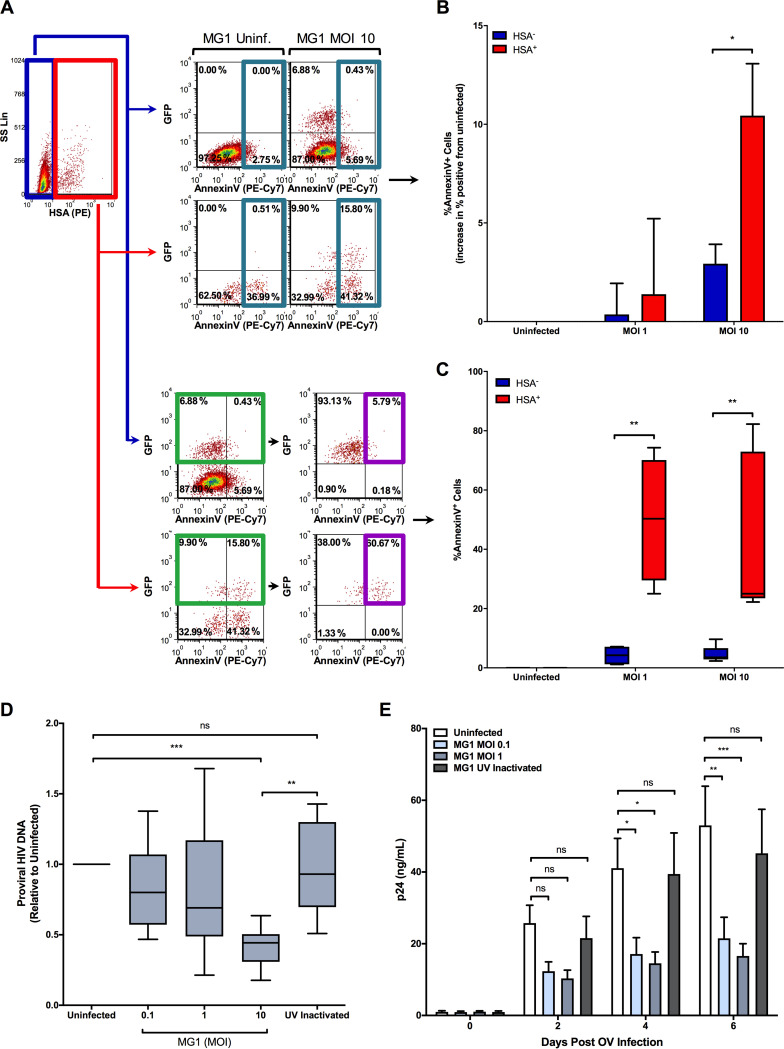
FIG 3.
MG1-infected, HSA+ MDM preferentially killed by MG1. (A) Representative dot plots depicting the gating strategy used to identify HSA−/GFP+/annexin V+ and HSA+/GFP+/annexin V+ MDM, as shown in panels B and C. HSA− (blue) and HSA+ (red) MDM were first defined by flow cytometry. To demonstrate that the surface expression of phosphatidylserine was increased following MG1 infection, the frequency of annexin V+ cells within the HSA− or HSA+ gates was measured at 24 h post-MG1 infection (top scatterplots; teal gates). To measure the amount of annexin V+ cells within the MG1-infected population, GFP+ cells were gated upon (bottom; green gate), and the frequency of annexin V+ MDM within HSA+/GFP+ and HSA−/GFP+ cell gates was measured (bottom; purple gate). (B) Cumulative data showing the difference in frequency of annexin V+ cells between MG1-infected and uninfected MDM cultures (n = 4; P = 0.013 by 2-way repeated-measures ANOVA; *, P < 0.05 by Bonferroni posttest). (C) Cumulative data showing the frequency of annexin V+ cells within HSA+/GFP+ and HSA−/GFP+ MDM gates. This was shown as the percentage of HSA−/GFP+/annexin V+ MDM and HSA+/GFP+/annexin V+ MDM at 24 h post-MG1 infection (uninfected and at an MOI of 10, n = 5; at an MOI of 1, n = 4; P = 0.004 by 2-way repeated-measures ANOVA; **, P < 0.01 by Bonferroni posttest). (D) Proviral HIV-1 DNA, measured relative to the MG1-uninfected control, at 48 h post-MG1 infection (n = 10; P = 0.0004 by 1-way repeated-measures ANOVA; **, P < 0.01; ***, P < 0.001 by Bonferroni posttest). (E) Quantification of HIV-1 p24 antigen in culture supernatants following MG1 infection (uninfected, MOI 0.1, and MOI 1, n = 6; UV inactivated, n = 4; P < 0.0001 by 2-way ANOVA; *, P < 0.05; **, P < 0.01; ***, P < 0.001 by Bonferroni posttest; ns, not significant). Data represent mean ± SEM; n values represent separate biological replicates.

