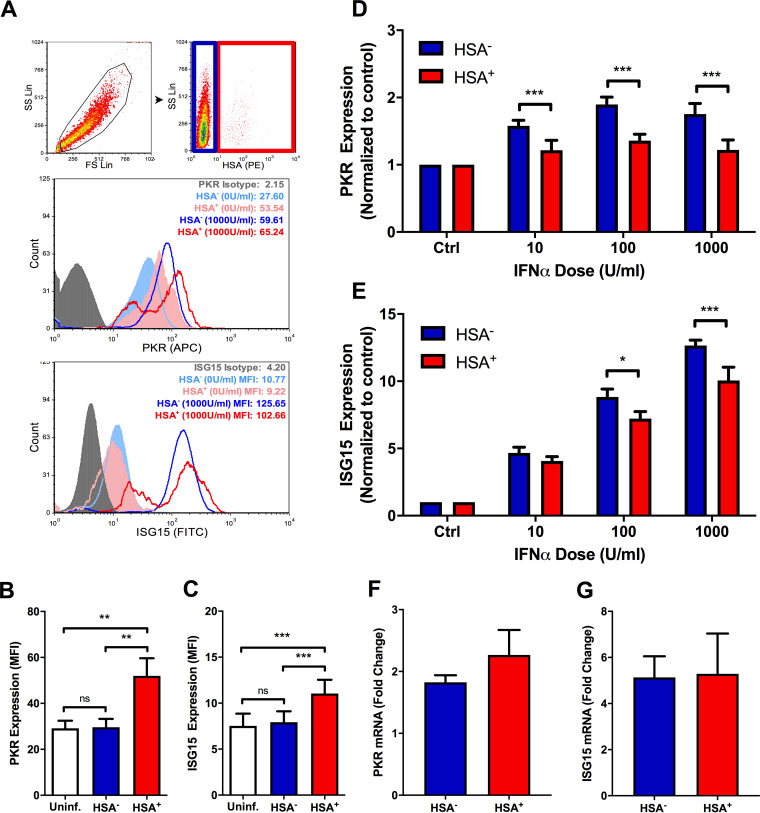
FIG 7.
Differences in basal and IFN-α-induced ISG expression exist between HIV-infected and bystander MDM. (A) Flow cytometry gating strategy. Intact cells were gated (black), after which HSA− (blue) and HSA+ (red) MDM were defined. Representative histograms show PKR (top) and ISG15 (bottom) induction in IFN-α-stimulated MDM. Respective isotype controls are shown in gray; HSA− MDM are shown in blue (filled, unstimulated; open, stimulated); HSA+ MDM are shown in red (filled, unstimulated; open, stimulated). Histogram peak counts (y axis) for HSA− and HSA+ populations were normalized to that of the isotype control for visualization purposes. SS Lin, side scatter, linear scale; FS Lin, forward scatter, linear scale. (B) Basal PKR expression in uninfected (white), HSA− (blue), and HSA+ (red) MDM (n = 6; P = 0.001 by 1-way repeated measures ANOVA; **, P < 0.01 by Bonferroni posttest). (C) Basal ISG15 expression in uninfected (white), HSA− (blue), and HSA+ (red) MDM (n = 7; P = 0.0001 by 1-way repeated measures ANOVA; ***, P < 0.001 by Bonferroni posttest). (D) Relative PKR induction following 24 h of IFN-α stimulation, normalized to respective unstimulated controls (n = 6; P = 0.023 by 2-way repeated measures ANOVA; ***, P < 0.001 by Bonferroni posttest.). (E) Relative ISG15 induction following 24 h of IFN-α stimulation, normalized to respective unstimulated controls (n = 7; P < 0.0001 by 2-way repeated measures ANOVA, *, P < 0.05, ***, P < 0.001 by Bonferroni posttest; ns, not significant). (F) PKR mRNA measured in HSA+ and HSA− MDM at 16 h poststimulation with 1,000 U/ml IFN-α. (G) ISG15 mRNA measured in HSA+ and HSA− MDM at 16 h poststimulation with 1,000 U/ml IFN-α. ΔΔCTs used to determine fold change were calculated by normalizing threshold cycle (CT) values to those of the respective untreated control and GAPDH (n = 4). Data represent mean ± SEM; n values represent separate biological replicates.

