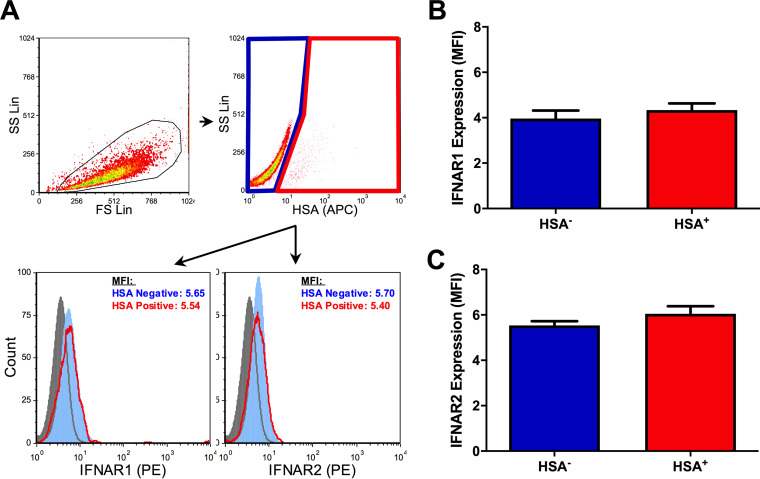
FIG 8.
Surface expression of IFNAR1/2 on HSA+ and HSA− MDM. (A) Flow cytometry gating strategy and representative histograms (filled gray, PE FMO control; filled light blue, HSA− MDM; empty red, HSA+ MDM) depicting IFNAR1 and IFNAR2 expression on HSA− and HSA+ MDM. Intact cells were gated (black), after which HSA− (blue) and HSA+ (red) MDM were defined. Histogram peak counts (y axis) for HSA− and HSA+ populations were normalized to that of the PE FMO control for visualization purposes. (B) IFNAR1 expression on HSA− (blue) and HSA+ (red) MDM, as measured by mean fluorescent intensity (n = 7). (C) IFNAR2 expression on HSA− and HSA+ MDM, as measured by mean fluorescent intensity (n = 7). Data represent mean ± SEM; n values represent separate biological replicates.

