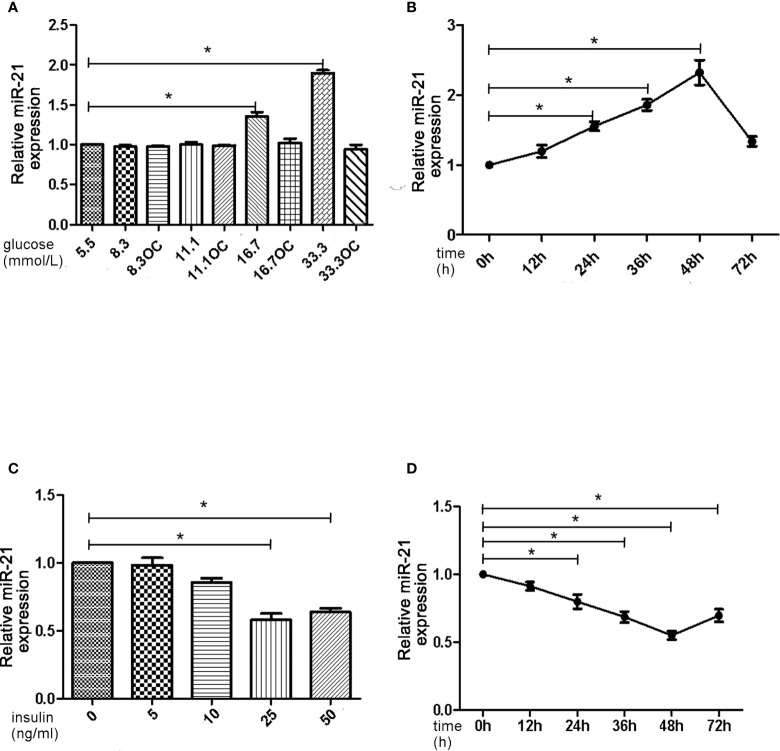
Figure 1.
High insulin and glucose concentrations have opposite effects on the expression of miR-21. (A): qRT-PCR analysis of miR-21 in HGECs after treatment with different concentrations of glucose for 48 h. (B): qRT-PCR analysis of miR-21 in HGECs treated with 33.3 mmol/L glucose for different periods of time. (C): qRT-PCR analysis of miR-21 in HGECs after treatment with different concentrations of insulin for 48 h. (D): qRT-PCR analysis of miR-21 in HGECs treated with 50 ng/mL insulin for different periods of time. Data are presented as means ± SD, *P < 0.05. All data are representative of three independent experiments. OC, osmotic control. qRT-PCR, quantitative real-time polymerase chain reaction.

