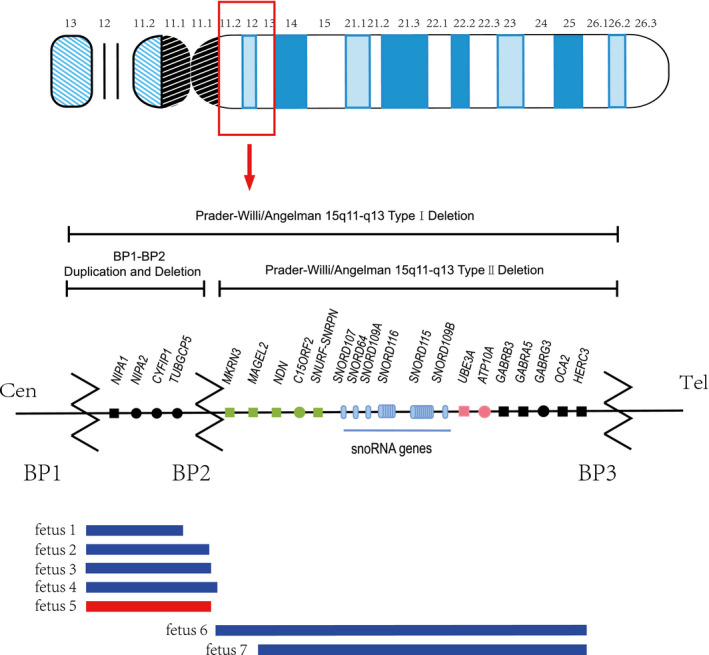
FIGURE 1.

Schematic maps of human chromosome 15q11‐q13. Green and pink represent paternally and maternally expressed imprinted genes, respectively; black indicates biallelic, nonimprinted genes; and squares are Morbid genes. BP1‐BP3 is shown with locations of the microdeletion and microduplication reported here. Our fetal microdeletion is depicted in blue, and our fetal microduplication is shown in red
