Figure 1.

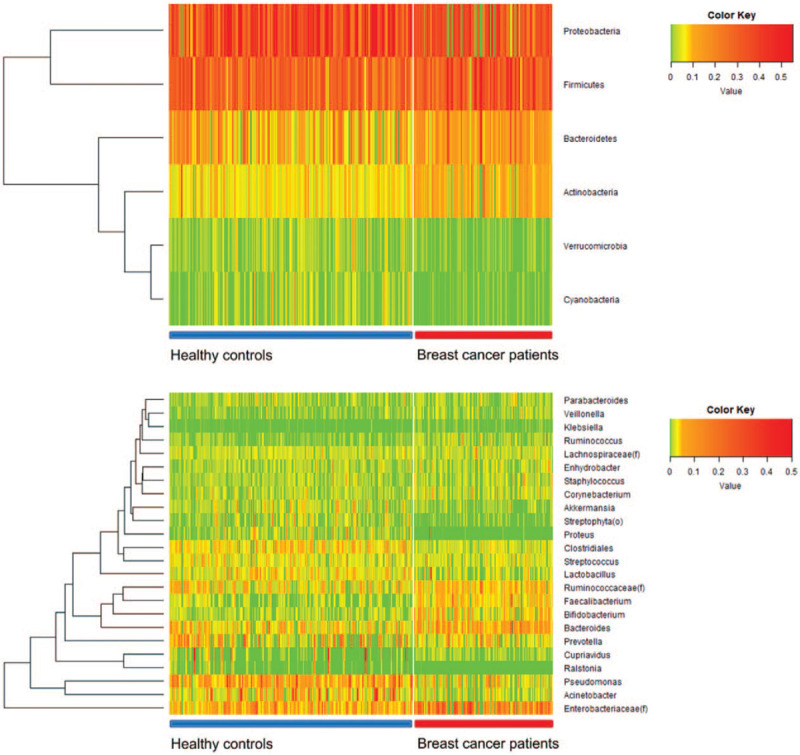
Heat map shows the relative abundance of different phyla and genera of the microbiomes of breast cancer patients and healthy controls. The upper heat map shows the difference in phyla and the lower heat map shows the difference in genera.

Heat map shows the relative abundance of different phyla and genera of the microbiomes of breast cancer patients and healthy controls. The upper heat map shows the difference in phyla and the lower heat map shows the difference in genera.