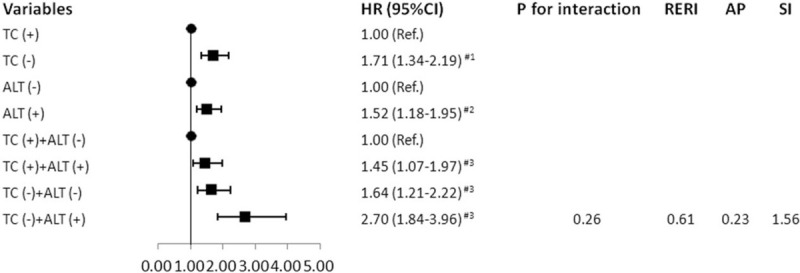
Figure 2.

The adjusted HR (95%CI) and interaction terms for PLC in different status of TC and ALT. #3: Adjusted for age, gender, BMI, HDL-C, hs-CRP, TG, hypertension, diabetes, alcohol consumption, smoking and physical activity; #2: Further adjusted for TC based on #3; #1: Further adjusted for ALT based on #3. AP = proportion of disease attributable to interaction, CI = confidence interval, HR = Hazard ratios, Ref = reference, RERI = relative excess risk due to interaction, SI = synergy index.
