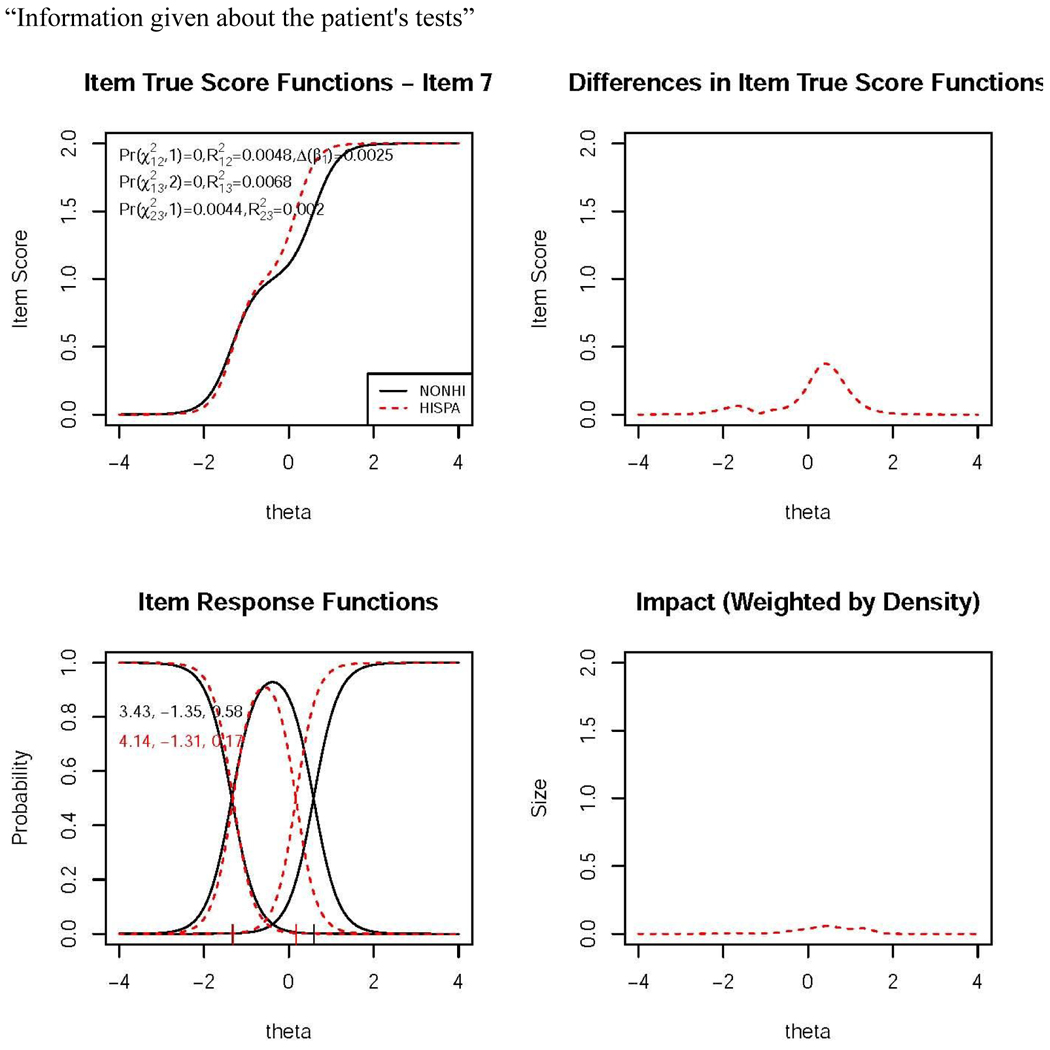
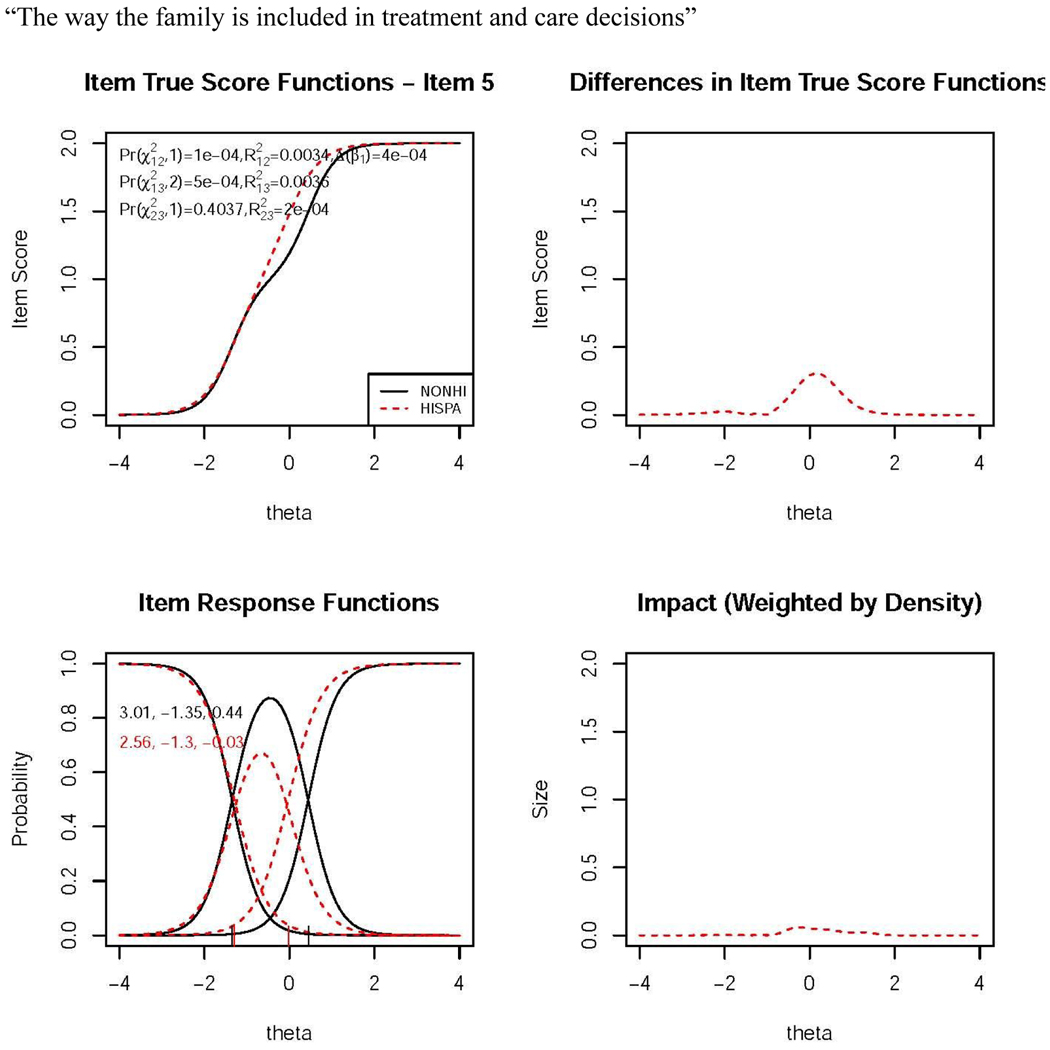
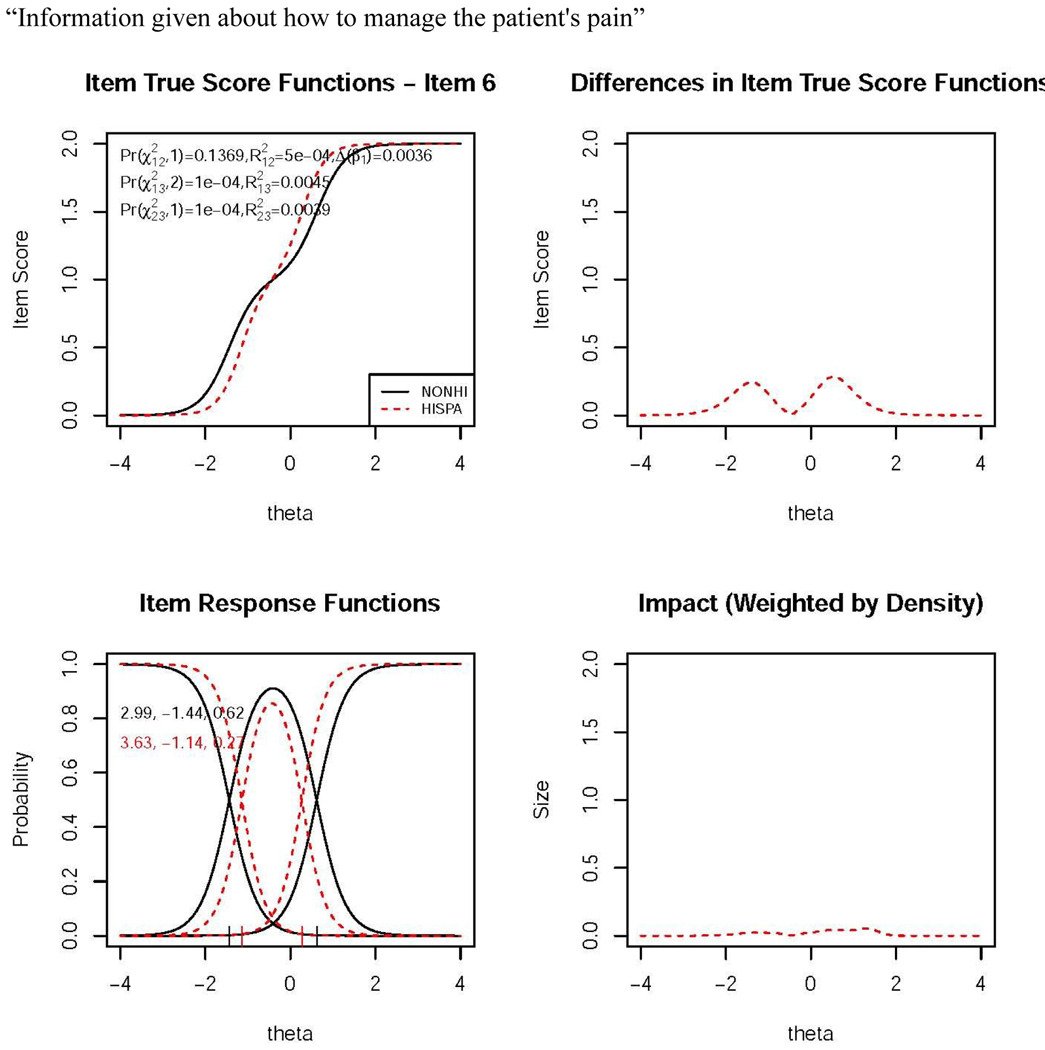
Appendix Figure A1. Item response functions and magnitude of DIF.

Note: Results are from lordif software. For each item the upper left panel shows the expected item score plots (denoted item true score functions) for Hispanics and non-Hispanic Whites. The lower left panel shows the item characteristic curves (category response functions). The upper right panel displays the absolute group differences in expected item scores. The lower right panel shows the differences weighted by density and is indicative of the magnitude (impact) of DIF at the item level. This measure is related to the non-compensatory DIF statistic (NCDIF) described in the text.


