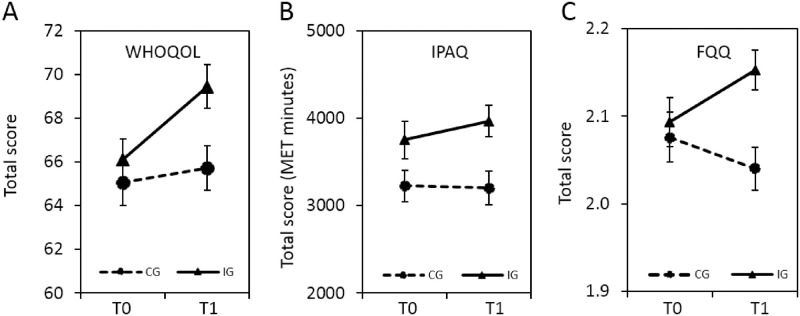
Fig 2. Primary endpoints.
Effects of Optimune on quality of life, dietary habits and physical exercise habits. Mean total scores (error bars represent SEM) are shown for each outcome measure before the intervention (T0, baseline) and at the end of the intervention (T1, 3 months). Treatment had significant effects on (A) quality of life and (C) dietary habits, whereas there was no effect on (B) physical exercise. MET (metabolic equivalent task, in minutes per week), IG (intervention group, n = 181), CG (control group, n = 182).

