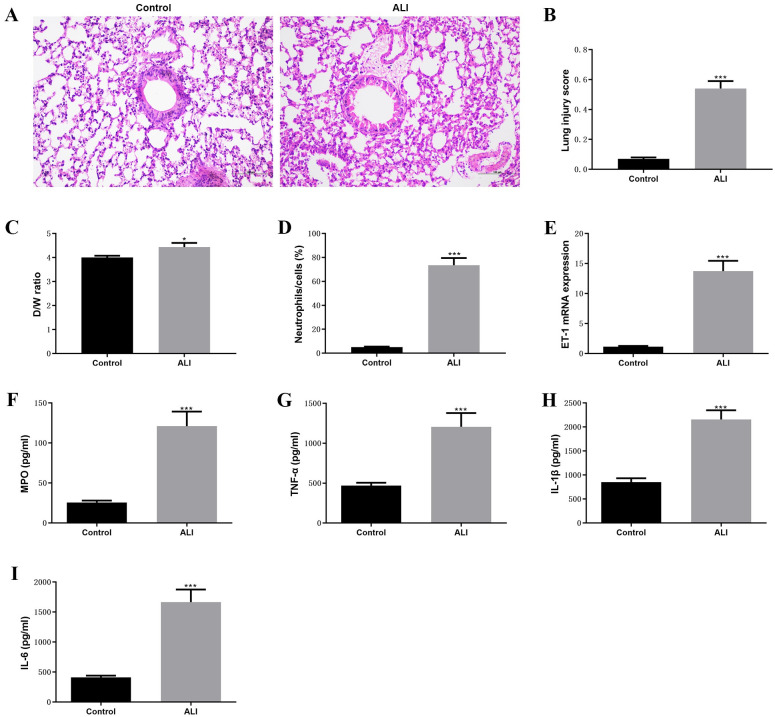
Fig 2. Established of LPS-induced ALI mouse model.
(A)-(D) The histology of lung tissue calculated using H & E staining, lung injury score, D/W ratio, and infiltrated neutrophils between ALI and control groups, respectively. (E) The mRNA expression of ET-1 between ALI and control groups were determined by RT-qPCR. (F)-(I) The levels of MPO, TNF-α, IL-1β, and IL-6 between ALI and control groups were detected by ELISA assay. ***P<0.001.

