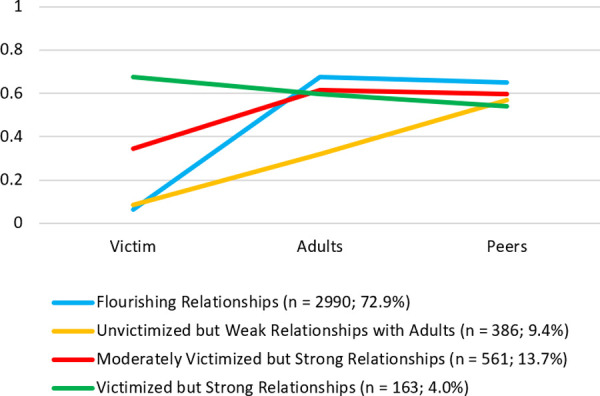
Fig 3. Selected 4-class latent profile analysis solution and class proportions among 4th graders (N = 4,100).

Victim = victimization; Adults = connectedness with adults at home; Peers = peer belonging. Given their different response scales, scores on each variable were linearly transformed onto the same 0–1 scale using the proportion of maximum scoring transformation.
