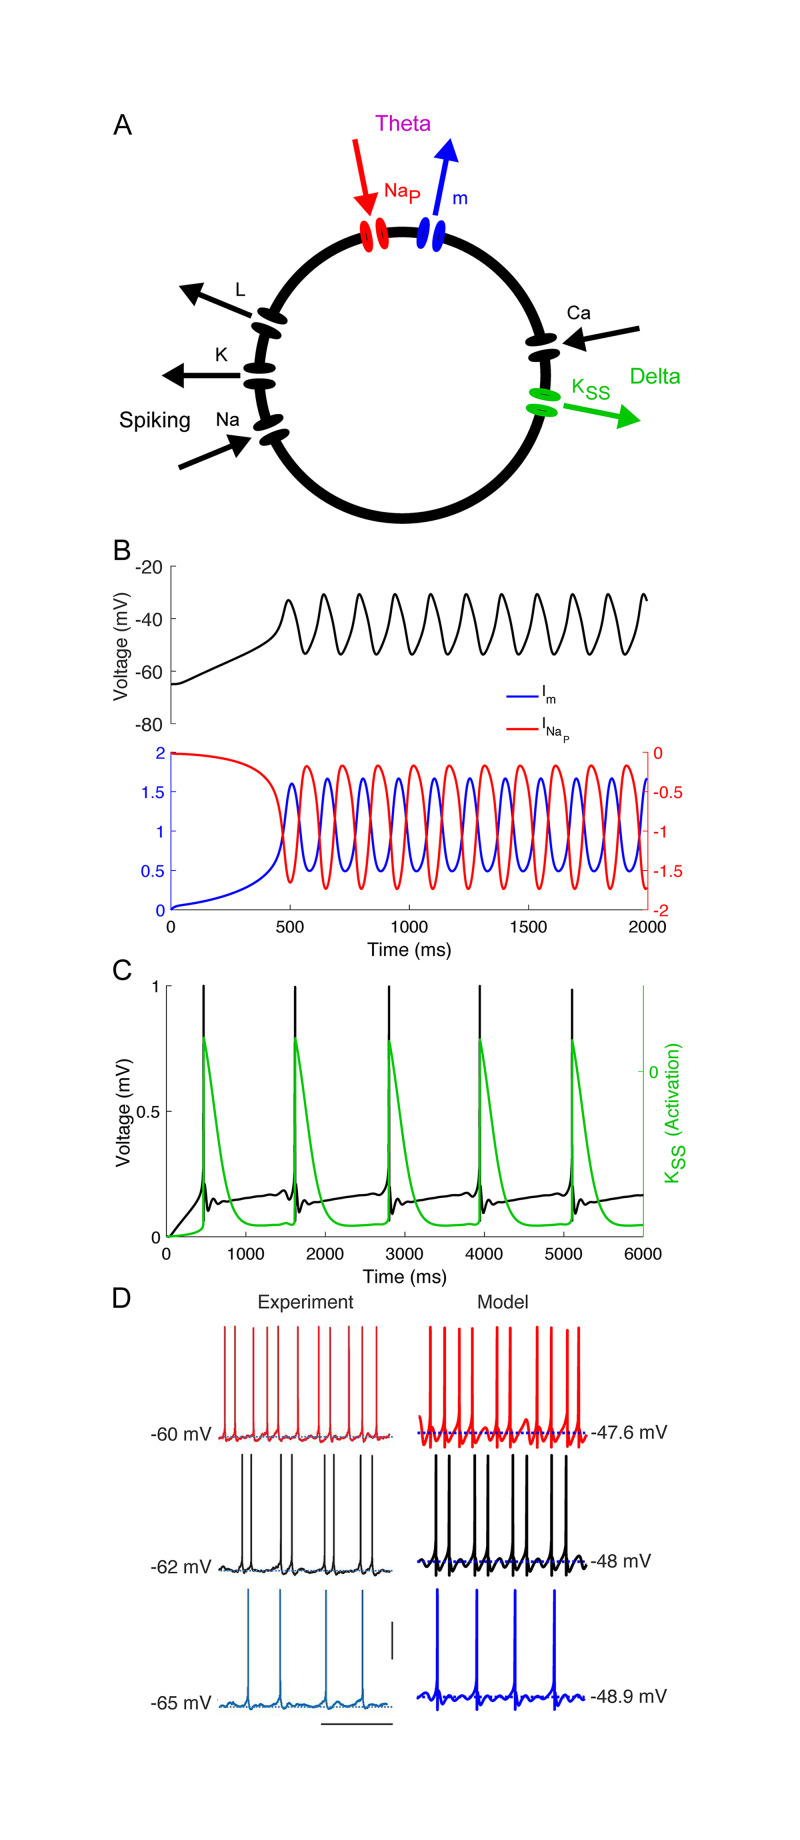
Fig 2. Model MS reproduces in vitro data.
(A) Diagram of model MS. Arrows indicate directions of currents (i.e., inward or outward). (B) θ timescale STOs arise from interactions between m- and persistent sodium currents in a model without spiking or Ca-dependent currents (only gm and nonzero). (C) δ timescale activity-dependent hyperpolarization arises from a super-slow K current. (D) Comparison between in vitro (adapted from [50]) and model data (vertical bar 50 μV, horizontal bar 0.5 ms).

