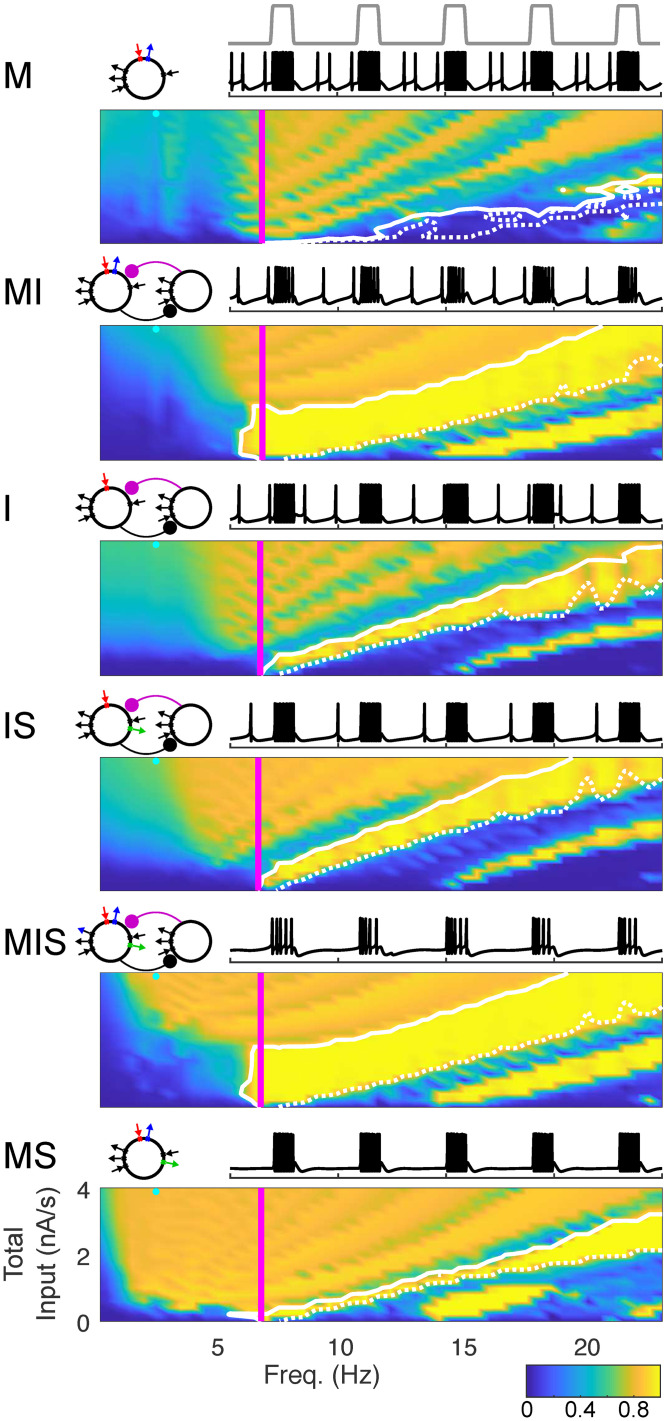
Fig 3. Phase-Locking as a Function of Periodic Input Frequency & Strength.
False-color images show the (spike-rate adjusted) phase-locking value (PLV, see Section 4.3) of spiking to input waveform. Vertical magenta lines indicating intrinsic spiking frequency. Solid white contour indicates boundary of phase-locking with one spike per cycle; dotted white contour indicates boundary of phase-locking with 0.9 spikes per cycle. Bands in false-color images of PLV are related to the number of spikes generated per input cycle: the highest PLV occurs when an oscillator produces one spike per input cycle, and PLV decreases slightly (from band to band) as both the strength of the input and the number of spikes per input cycle increases. Schematics of each model appear above and to the left; sample traces of each model appear above and to the right (voltage traces in black, input profile in gray, two seconds shown, input frequency 2.5 Hz, total input −3.4 nA/s, as indicated by cyan dot on the false-color image). Total input per second was calculated by integrating input over the entire simulation.

