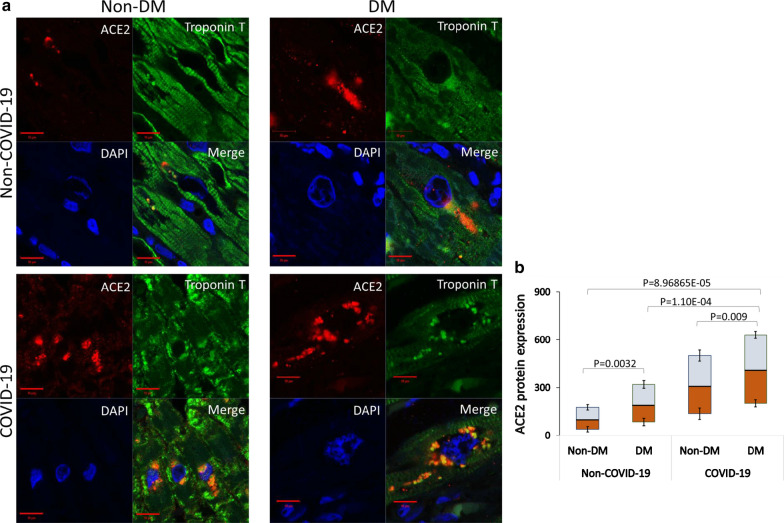
Fig. 2.
ACE2 immunofluorescence detection. a Representative images of ACE2 expression (red) and cardiac troponin T (green) in non-COVID-19 and COVID-19 heart tissue from patients with diabetes (DM) and patients without diabetes (Non-DM). Cell nuclei were stained blue with DAPI. b Fluorescence intensity analysis in the Non-DM Non-COVID-19 (n = 43) versus DM Non-COVID-19 (n = 7), (p = 0.0032) and Non-DM COVID-19 (n = 17) versus DM COVID-19 (n = 30), (p = 0.009) of myocardial ACE2 expression was estimated with Image J software. Analysis comparing DM COVID-19 versus Non-DM Non-COVID-19 (p = 8.96865E−05) and DM COVID-19 versus DM Non-COVID-19 (p = 1.10E−04) was also reported. Shown as mean ± SD. Statistical test: Student’s t-test. Bonferroni correction was used to make pairwise comparisons. Data were presented as box and whisker plots showing medians (middle line) and in boxes the third and first quartiles (75th and 25th percentiles), while the whiskers show 1.5 × the interquartile range (IQR) above and below the box. Scale bar = 10 µm. ACE2 angiotensin-converting enzyme 2

