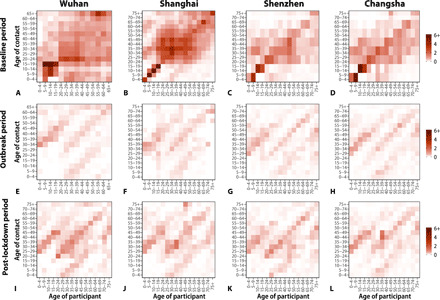
Fig. 2. Contact matrices by age.

(A) Baseline period contact matrix for Wuhan (regular weekday only). Each cell of the matrix represents the mean number of contacts that an individual in a given age group has with other individuals, stratified by age groups. The color intensity represents the numbers of contacts. To construct the matrix, we performed bootstrap sampling with replacement of survey participants weighted by the age distribution of the actual population of Wuhan. Every cell of the matrix represents an average over 100 bootstrapped realizations. (B) Same as (A), but the contact matrix weighted by weekday and weekends for Shanghai. (C and D) Same as (A), but for Shenzhen and Changsha. (E to H) Same as (A), but for the outbreak contact matrices for Wuhan, Shanghai, Shenzhen, and Changsha. (I to L) Same as (A), but for the post-lockdown contact matrices weighted by weekday and weekends for Wuhan, Shanghai, Shenzhen, and Changsha.
