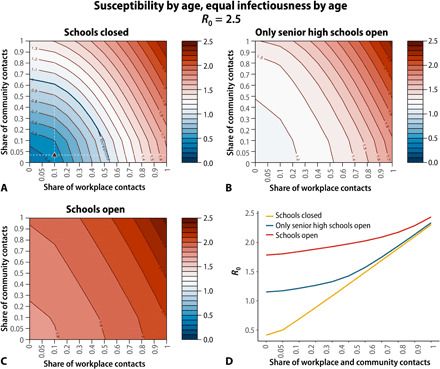
Fig. 4. Estimated R0 for Shanghai under different assumptions on the number of contacts in workplaces, community, and schools.

(A) Heatmap of the estimated mean value of R0 for a different combination of number of contacts in the workplaces and community under the assumption that all schools are closed. Share equal to 1 corresponds to the pre-pandemic contact pattern. The triangle corresponds to the measured share of contacts in the workplace and the community during the post-lockdown period. Baseline period R0 was set to 2.5, and we considered age-specific susceptibility to infection as in (9), and no differences in infectiousness by age. R0 values are estimated through the next-generation matrix approach. (B) Same as (A), but assuming that contacts in senior high schools are as in the pre-pandemic period. (C) Same as (A), but assuming that contacts in all schools (corresponding to the entire student population except for college students) are as in the pre-pandemic period. (D) Estimated mean value of R0 for different shares of workplace and community contacts under different levels of school closure.
