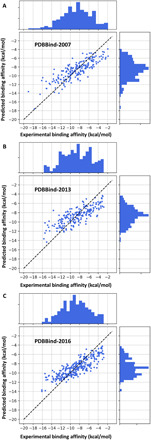
Fig. 6. Comparison of predicted protein-ligand binding affinities and experimental results for the three test sets.

(A) PDBbind -2007. (B) PDBbind-2013. (C) PDBbind-2016. The PCCs are 0.836, 0.793, and 0.840, respectively. The root mean square errors are 1.847, 1.956, and 1.724 kcal/mol, respectively.
