
Fig. 3. Fourier analysis of polaritonic images.
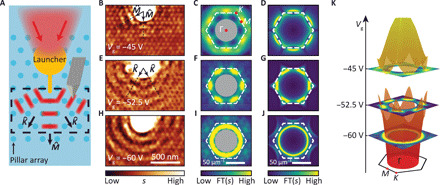
(A) Schematic of the device with the scanned region marked in the dashed box. (B) Near-field image obtained at Vg = −45 V, showing Bloch polaritons traveling predominantly in directions. (C) Symmetrized Fourier transform (FT) of the image in (B). The six bright features represent Bloch polaritonic modes around M points. Polaritonic features close to the Γ point are extraneous to our study and thus are shaded in the gray circle. Inset: First BZ marked with symmetry points. (D) Simulated Fourier transform at . (E) to (G) same as (B) to (D) at Vg = −52.5 V and . Bloch polaritons propagate predominantly along directions (E). The Fourier transform (F) shows six polaritonic pockets near K points in accord with the simulation (G). (H) to (J) same as (B) to (D) at Vg = −60 V and . The near-field image shows that Bloch polaritons propagate isotropically in all directions (H) and the Fourier transform (I) shows circular equi-energy contours, which agrees with the simulation (J). (K) Stacked equi-energy contours for selected gate voltages and overlaid with the theoretical polaritonic band structure.