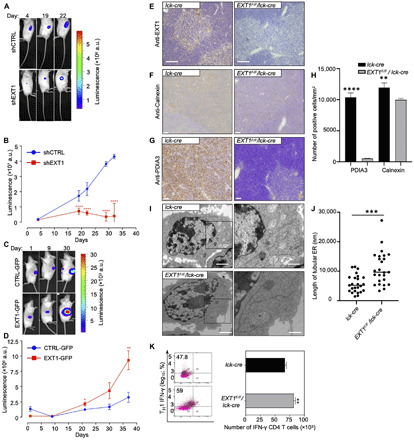
Fig. 2. Cancer dependency to EXT1 expression is associated with perturbations of ER structures.

(A and B) Follow-up of the tumor progression via bioluminescence after injection of 2 × 10⁶ control and shEXT1 Jurkat cells at opposites sites of NOD/SCID mice. a.u., arbitrary units. ****P < 0.0001. (C and D) As in (A) and (B) for CTRL–GFP (green fluorescent protein) and EXT1-GFP cells. One-way analysis of variance (ANOVA), *P < 0.05, **P < 0.01, and ****P < 0.0001 (n = 6 to 10 mice per group). (E) Immunohistochemistry staining of EXT1 protein in thymus of lck-cre (left) and EXT1F/F/lck-cre (right) mice. Scale bars, 2 μm. (F) As in (E) but immunohistochemistry staining with anti-Calnexin antibody. Scale bars, 2 μm. (G) As in (E) but immunohistochemistry staining with anti–protein disulfide isomerase family A member 3 (PDIA3) antibody. Scale bars, 2 μm. (H) Quantifications of NanoZoomer Digital Pathology Image (ndpi) slide scans using QuPath 0.2.0-m8. Positive cells per square millimeter from indicated conditions are plotted. One-way ANOVA, **P < 0.01 and ****P < 0.0001 (n = 4 scan area per staining, five mice per group). (I) TEM of ER in activated T cells from murine peripheral lymph nodes and spleen. Scale bars, 2 μm. Boxed region illustrates the ER. (J) Quantification of the length of tubular ER. One-way ANOVA, ***P < 0.001 (n = 25 cells, 6 to 10 mice per group). (K) The percentages of interferon-γ (IFN-γ) in T helper 1 cell (TH1) from lck-cre and EXT1F/F/lck-cre mice are shown in quadrants. Percentages of IFN-γ+ cells are shown in quadrants. Bar graphs represent mean number ± SD. One-way ANOVA, **P < 0.01 (n = 6 to 10 mice per group). See also figs. S1 and S2.
