
Fig. 3. EXT1 down-regulation causes ER extension and cell size increase.
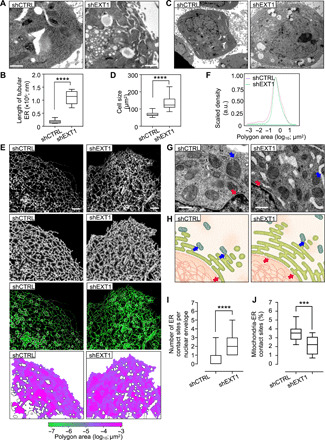
(A) TEM of the ultrastructure ER of HeLa cells. Scale bars, 2 μm. (B) Quantification of the length of tubular ER (in nanometers) per cell (n = 10 cells, three independent experiments). Box plot indicates that the mean and whiskers show the minimum and maximum values. One-way ANOVA, ****P < 0.0001. (C) TEM of HeLa shCTRL and shEXT1 cells. Scale bars, 2 μm. (D) Quantification of the cell area (n = 19 to 22 cells, three independent experiments; table S1). One-way ANOVA, ****P < 0.0001. (E) Confocal fluorescence of Cos7 cells shCTRL or shEXT1 transiently expressing mEmerald-Sec61b. From top to bottom: original image, skeleton, overlay of the skeleton (purple), the cisternae (white) and the original image (green), polygonal regions map, and color-coded by size. (F) Quantitative analysis based on the skeletonization model of Cos7 cells expressing mEmerald-Sec61b under shCTRL and shEXT1 condition. Polygon area (log10) in x axis is plotted against scaled density in y axis (n = 19 to 24). (G) TEM of ER-mitochondria and ER–nuclear envelope contact sites in HeLa shCTRL and shEXT1 cells. Arrows in blue and red highlight the contact sites. The nuclear envelope–ER contact sites increase and the number of mitochondria-ER contact sites decreases following EXT1 depletion. Scale bars, 500 nm. (H) Schematic representation of the ER–other organelle contact sites, as used for the statistical analysis of the different parameters. (I) Quantification of the ER–nuclear envelope contact sites in box plot indicating that the mean and whiskers show the minimum and maximum values (n = 10 to 18 cells, three independent experiments). One-way ANOVA, ****P < 0.0001. (J) As in (I) but percentage of ER-mitochondria contact sites (n = 10). One-way ANOVA, ***P < 0.001. See also figs. S2 and S3.