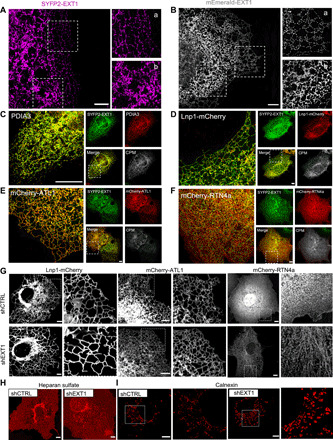
Fig. 6. EXT1 localizes in ER tubules and sheet matrices.

(A and B) STED (A) and SIM (B) images of Cos7 cells expressing SYFP2-EXT1 and mEmerald-EXT1, respectively. Boxed regions illustrate the tubular (subpanel a) and the cisternal (subpanel b) ER. Scale bars, 4 μm. (C) Confocal fluorescence microscopy of Cos7 cells transiently expressing SYFP2-EXT1 (green) and endogenous ER marker PDIA3 (red). The subpanels show the individual and merged channels and the colocalized pixel map (CPM). Scale bar, 4 μm. (D to F) As in (C) but coexpression of SYFP2-EXT1 (green) and indicated ER markers (red). Scale bars, 4 μm. (G) Live imaging of shCTRL and shEXT1 Cos7 cells stably expressing indicated ER markers. Scale bars, 4 μm. Boxed region illustrates the ER. (H) HS endogenous staining (red) of Cos7 cells. Scale bars, 5 μm. (I) Endogenous staining (red) of Cos7 cells with Calnexin antibody. Boxed regions magnified illustrate a zoom of circular, vesicle-like structures that appear following EXT1 k.d. Scale bars, 4 μm. See also fig. S6.
