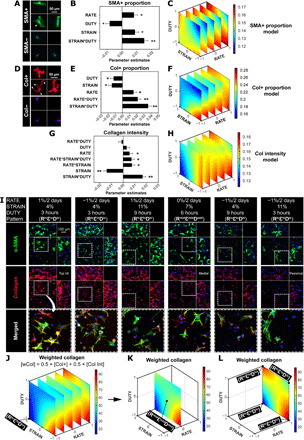
Fig. 2. Interaction between strain magnitude and duty period dominated MSC mechano-responsiveness.

Parametric models of MSC responses for (A to C) the proportion of SMA+ cells, (D to F) proportion of Col+ cells, and (G and H) collagen mean intensity after 1 week of full factorial screening. (A) Example of a SMA+ cell with visible α-SMA stress fiber formation (top) (arrowhead) and a SMA− cell (bottom). SMA, green; nucleus, blue. (D) Example of a Col+ cell with visible collagen (in red) at the spreading cell protrusions and edges (top) (arrowheads) and a Col− cell (bottom). (B, E, and G) Summaries of factor effects (parameter estimates) for the proportion of SMA+ cells, proportion of Col+ cells, and collagen mean intensity. Larger coefficient magnitude of the parameter estimate corresponds to a larger effect of that factor on the model output. (C, F, and H) 4D response surface plot of the interaction between RATE, STRAIN, and DUTY on SMA+ proportion, Col+ proportion, and collagen mean intensity. The definition of the coded values is provided in table S1. (I) Representative maximum intensity projections of cells stained with α-SMA and collagen type I among various patterns of condition. Peripheral images are side view projections. Refer to table S2 for the polynomial models of SMA+ proportion, Col+ proportion, and collagen mean intensity. Error bars represent SE of the estimated parameters. N = 3 to 4 independent gels per condition. **P < 0.0001 and *P < 0.05. (J to L) The new metric weighted collagen (wCol) was defined to identify the top hit, medial, and pessimal conditions for further validation. Conditions selected are labeled on the graph and listed in table S3. (J) 4D response surface plot of the interaction between RATE, STRAIN, and DUTY on wCol. (K and L) Response surfaces of wCol with RATE at 0%/2 days (K) and at 1%/2 days (L).
