
Fig. 3. Empirically driven model generated a hypothesis to enhance matrix production.
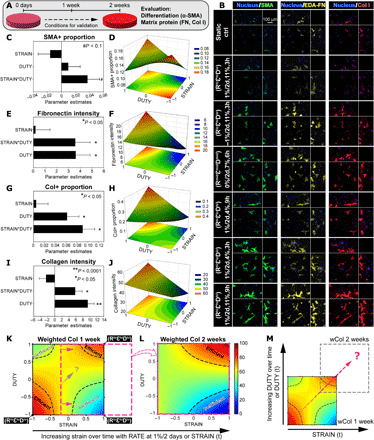
(A) Overview of the 2-week validation culture of selected conditions. (B) Representative maximum intensity projections of MSCs stained with α-SMA, extra domain-A fibronectin (EDA-FN), and collagen type I. Peripheral images are side view projections. (C to J) Parametric analysis of MSC responses in expression of (C and D) α-SMA, (E and F) fibronectin, and (G to J) collagen with RATE at 1%/2 days. (C, E, G, and I) Summaries of factor effects (parameter estimation) for SMA+ cell proportion, fibronectin intensity, Col+ cell proportion, and collagen intensity, respectively. Error bars represent SE of the estimated parameters. N = 3 to 4 independent gels per condition. **P < 0.0001, *P < 0.05, and #P < 0.1. (D, F, H, and J) Response surfaces of the STRAIN*DUTY interaction on SMA+ proportion, fibronectin intensity, Col+ proportion, and collagen intensity, respectively. 2D projections of the response surfaces are shown at the bottom in each plot. (K) Response surface of weighted collagen by 1 week with highlighted regions of efficient stimulation and inefficient stimulation (dashed outline) (RATE at 1%/2 days). (L) Response surface of wCol after 2 weeks of validation culture with regions of efficient and inefficient stimulation, shifted from that of 1 week in the direction of increasing STRAIN (pink arrows and outline). (M) Differences in response surfaces of wCol between 1 and 2 weeks, due to dynamic changes in the STRAIN*DUTY interaction effect, generated a hypothesis to optimally promote collagen production by MSCs (dashed arrow).