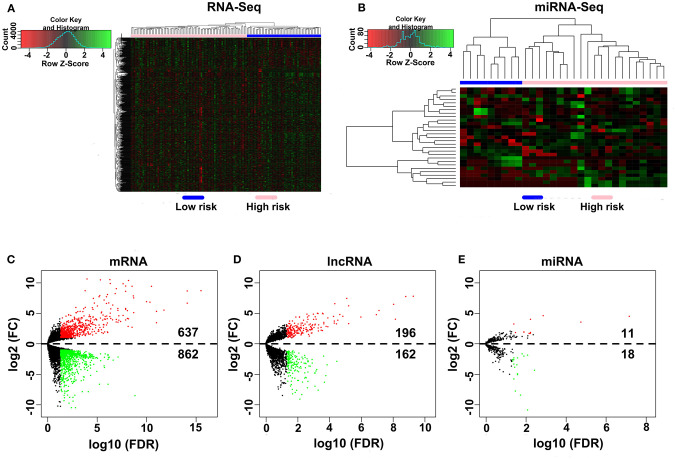
Figure 1.
Differential expression gene analyses. (A,B) DEG heatmap of the RNA-Seq and the miRNA-Seq. (C–E) Screening of the DEmRNA, DElncRNA, and DEmiRNA. Black points represent the insignificant genes, red points represent the upregulated genes, and green points represent the downregulated genes. FC, fold change. Threshold criteria: FC > 2 and FDR < 0.05.

