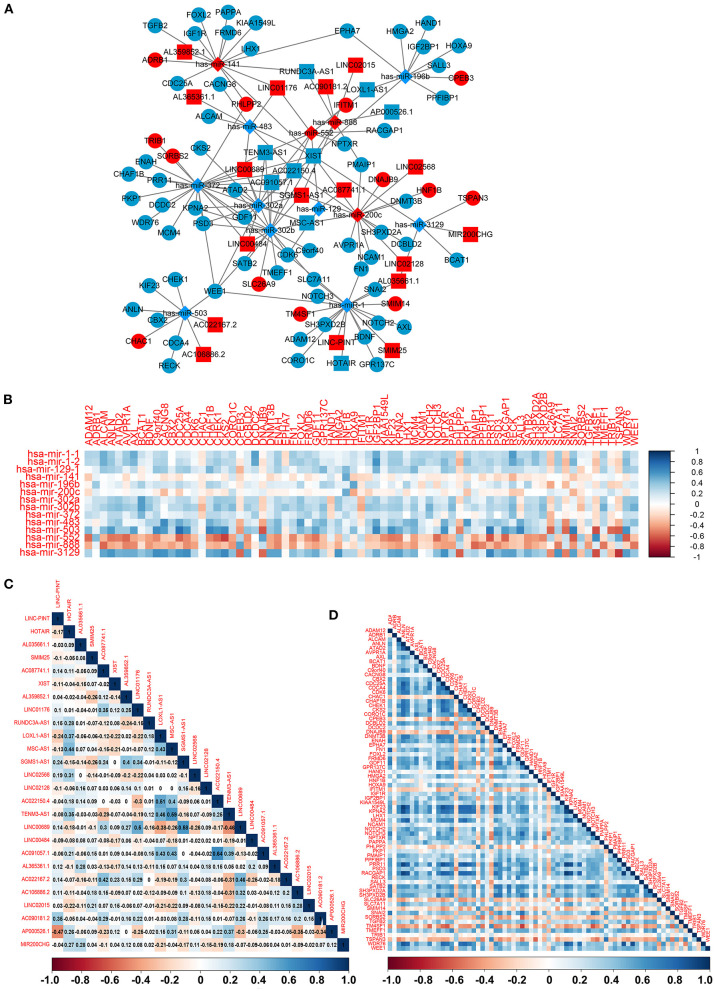
Figure 4.
The construction of the ceRNA network among the 26 lncRNAs, 13 miRNAs, and 73 mRNAs. (A) The ceRNA network among lncRNA–miRNA–mRNA. Ellipse represents mRNA. Rectangle represents lncRNA. Diamond represents miRNA. Red represents upregulation, and blue represents downregulation. (B–D) The Pearson correlation analyses among the miRNA–mRNA, 26 lncRNAs, and 73 mRNAs.

