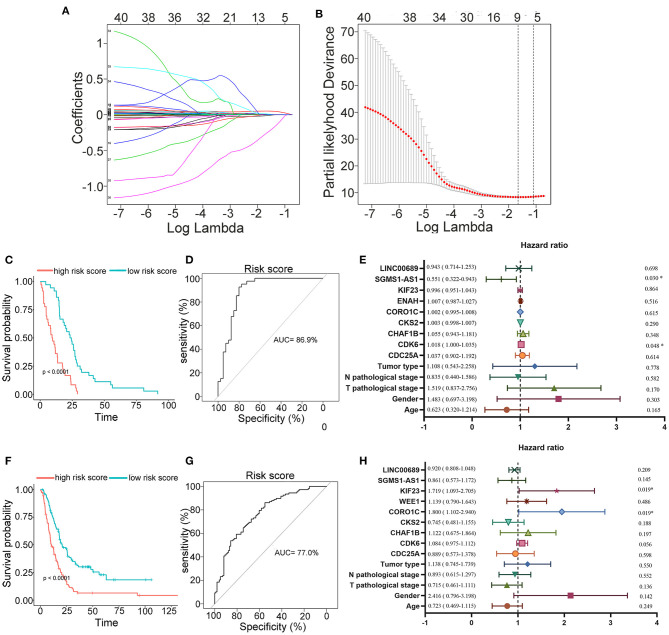
Figure 5.
Construction, estimation, and validation of the risk model. (A) Least absolute shrinkage and selection operator (LASSO) coefficient profiles of the 40 genes. The value was chosen by 10-fold cross-validation. (B) The numbers above the graph represent the number of genes involved in the LASSO model. (C,D) Survival curve and ROC curve of the risk model according to the dataset of EGA. (E) Forest plot showing associations between the selected nine genes, the reported clinical factors, and the overall survival in the model. (F–H) Validation of the risk model based on the survival curve, the ROC curve, and the multivariate Cox analysis according to the EGA dataset. The significances of the survival curves were calculated by log-rank test. Also, the AUC values of ROC curves > 70% were regarded as efficient models.

