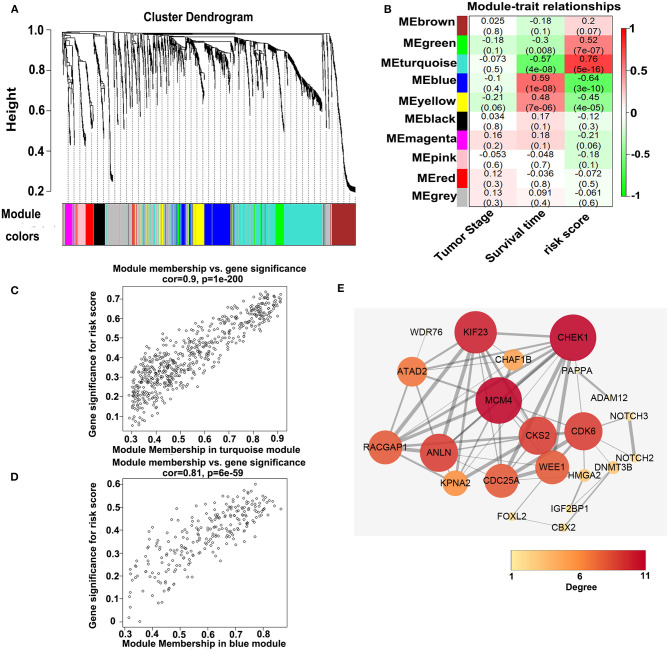
Figure 8.
WGCNA analyses of the DEmRNAs. (A) Identification of the co-expression modules. (B) Association between the modules and the traits. (C) Pearson correlations between the genes in the turquoise module and the risk score. (D) Pearson correlations between the genes in the blue module and the risk model. (E) Protein–protein interaction network analysis of the overlapped mRNAs in the ceRNA network and the turquoise module. The size and color of the round represent the number of links of the protein (gene).

