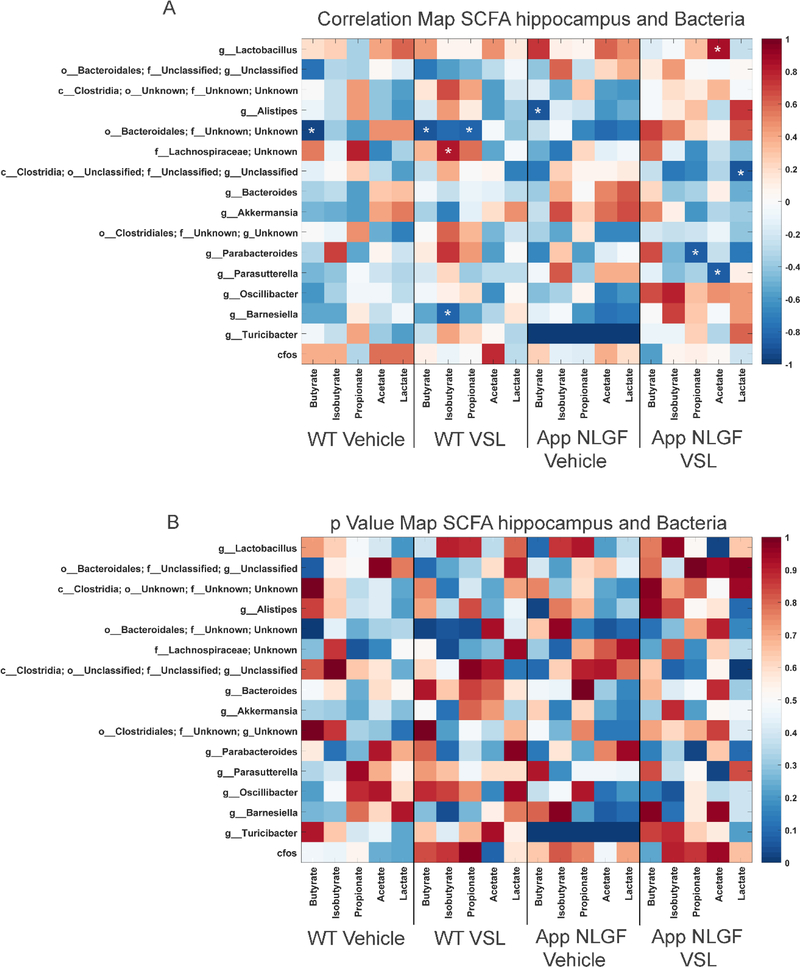
Fig. 5.
Comparison of hippocampal SCFAs and fecal microbiome bacteria in C57BL/6 (WT) and AppNL-G-F mice. Heat maps are presented of the Pearson correlation of (A) and the p value for hippocampal SCFAs and fecal bacterial composition. Asterisks in (A) indicate statistically significant positive or negative correlation.

