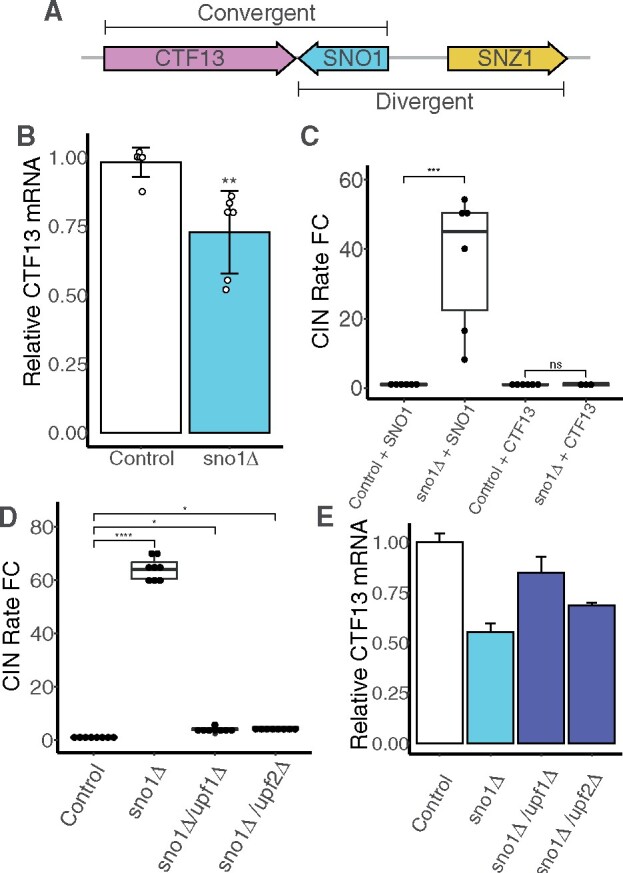
Figure 3.

CTF13 mRNA abundance is reduced in the sno1Δ mutant. (A) Graphical representation of the locus on ChrXIII containing CTF13 (pink), SNO1 (blue), and SNZ1 (yellow) drawn to scale. SNO1 and CTF13 are convergent gene pairs. SNO1 and SNZ1 are divergent gene pairs sharing a common promoter sequence. (B) qPCR analysis of CTF13 mRNA levels expressed as fold changes performed on control and sno1Δ strains using a CTF13 ORF primer set (set #3, see Supplementary Table S3). Six independent replicates were performed each including technical triplicates. Each values is normalized to the level of ACT1 mRNA. Technical triplicates are averaged and pooled together and standard deviation is calculated for Cq means of the independent strains. P-values are generated from a Tukey’s post hoc test. (C) CIN rate measurements for control strain and sno1Δ strain with either an additional copy of SNO1 or CTF13 integrated into an ectopic position on chrIV. P-values are generated from a Tukey’s post hoc test. (D) CIN rate measurements for sno1Δ and NMDΔ double mutants (sno1Δ/upf1Δ and sno1Δ/upf2Δ). P-values are generated from a Tukey’s post hoc test. (E) qPCR analysis of CTF13 mRNA extracted from strains listed in Figure 3D using a CTF13 ORF primer set (set #3, see Supplementary Table S3). Only one independent isolate for each strain was used in this experiment and the standard deviation is measured from the technical triplicates. This result was validated using the same cDNA samples with CTF13 primer set #1 (data not shown).
